Intake
Description
The Intake section provides three key report tabs to monitor and manage cattle feed consumption effectively:
- Yesterday
- History
- DMI Summary
Each tab provides detailed insights into feed intake, costs, and dry matter consumption (DMI) by pen and can be exported to PDF or Excel for offline analysis. Filters are available to customise the displayed data based on user needs.
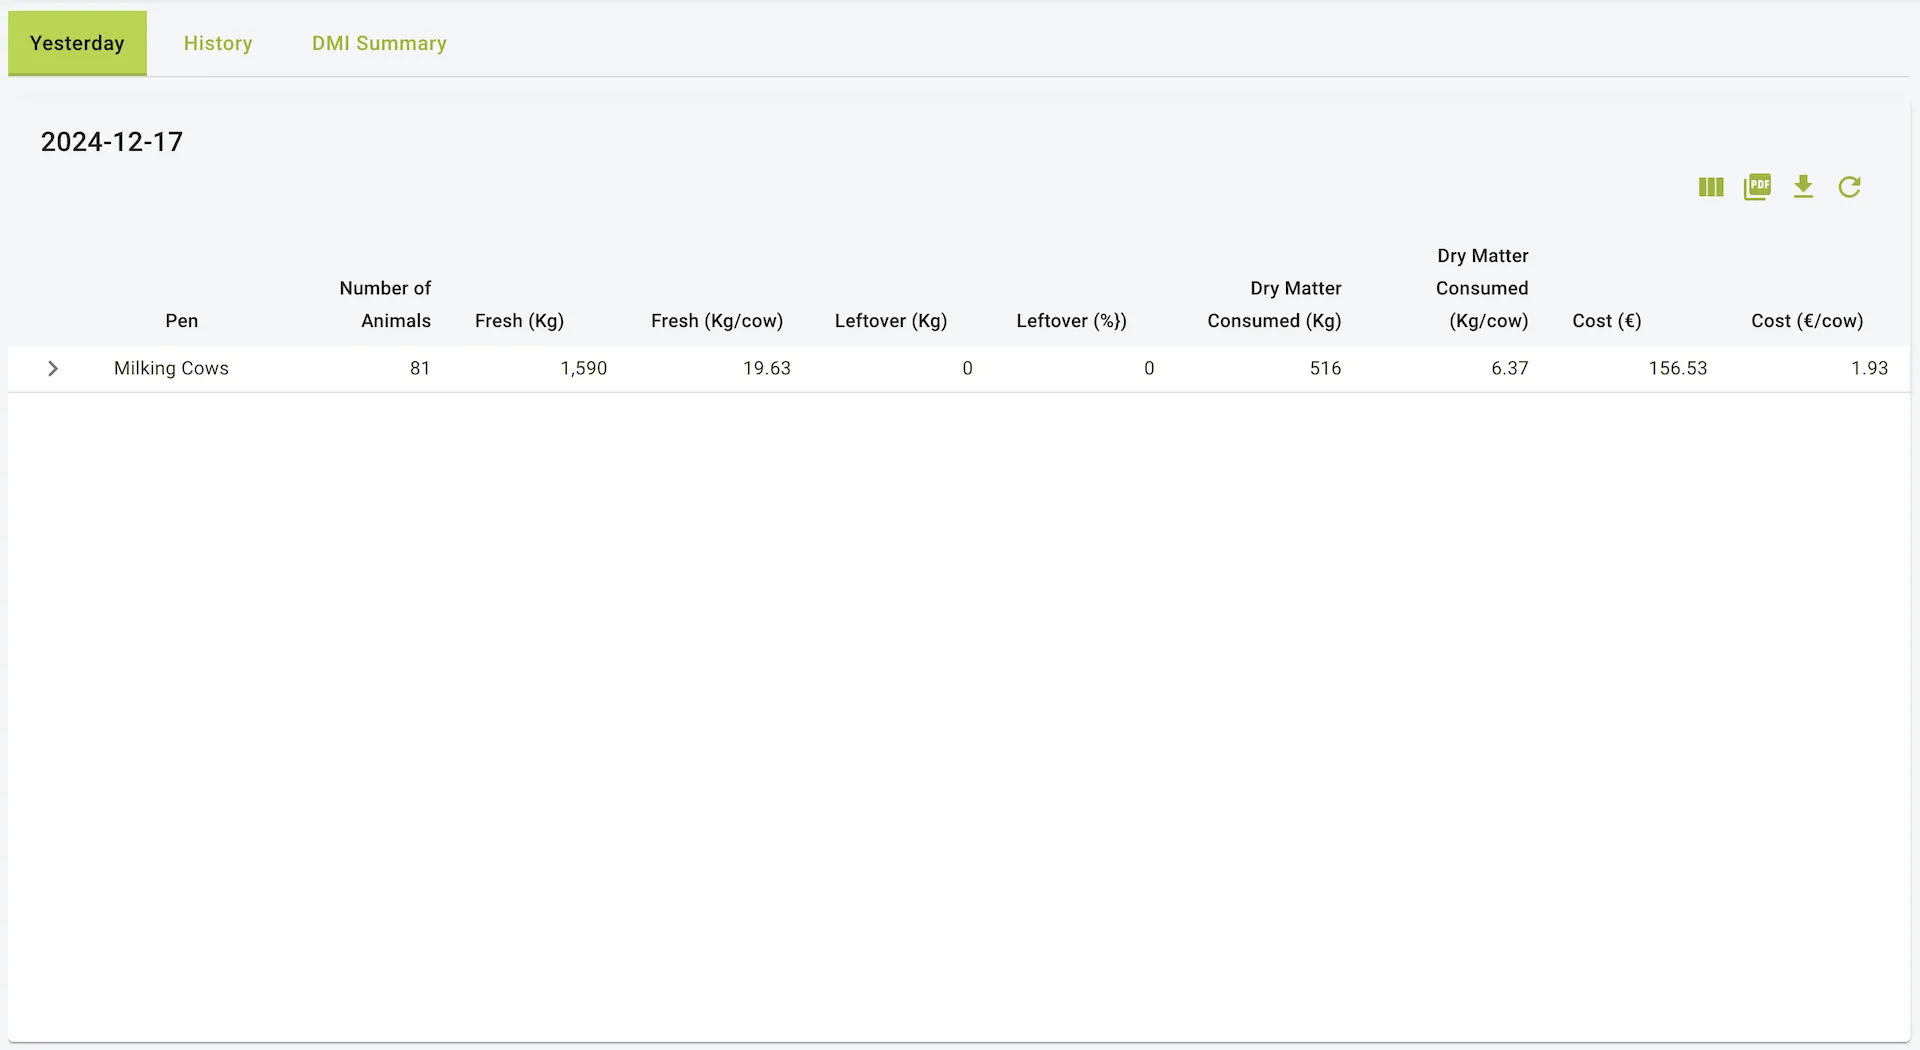
1. Yesterday Tab
Description:
The Yesterday tab provides a snapshot of feed data for the previous day. It summarizes key metrics for each pen, allowing users to monitor and evaluate feed intake, waste, and cost efficiency.
Fields:
- Pen: Name of the pen (e.g., “Milking Cows”, “New Slatted House Pen 3 calves”).
- Number of Animals: Total number of animals in the pen.
- Fresh (Kg): Total feed offered to the pen in kilograms.
- Fresh (Kg/cow): Average feed offered per cow.
- Leftover (Kg): Total feed left uneaten by the animals.
- Leftover (%): Percentage of the feed that was left uneaten.
- Dry Matter Consumed (Kg): Total dry matter intake (DMI) by the animals.
- Dry Matter Consumed (Kg/cow): Average dry matter consumed per cow.
- Cost (€): Total cost of the feed consumed.
- Cost (€/cow): Average cost of feed per cow.
Use Case:
This report is ideal for reviewing the previous day’s feeding performance and identifying any inefficiencies in feed consumption or cost management.
Features:
- Filter by Pen: Users can select specific pens to display relevant data.
- Export Options: Reports can be downloaded in PDF or Excel format.
2. History Tab
Description:
The History tab allows users to review feed data over a customizable date range. It enables comparison and trend analysis of feed metrics over time for better decision-making.
Fields:
- Date: The specific date of the record.
- Pen: Name of the pen.
- Number of Animals: Total number of animals in the pen.
- Fresh (Kg): Total feed offered to the pen.
- Fresh (Kg/cow): Average feed offered per cow.
- Leftover (Kg): Total feed left uneaten by the animals.
- Leftover (%): Percentage of the feed that was left uneaten.
- Dry Matter Consumed (Kg): Total dry matter intake (DMI).
- Dry Matter Consumed (Kg/cow): Average dry matter consumed per cow.
- Cost (€): Total feed cost.
- Cost (€/cow): Average cost per cow.
Use Case:
Users can refer to this tab to:
- Track feed consumption and costs over time.
- Analyse trends and adjust feeding strategies.
- Compare performance across different pens or groups of animals.
Features:
- Filter Options:
- Pen Filter: Display data for specific pens.
- Group Filter: Group data based on animal groups or custom classifications.
- Export Options: Data can be downloaded as PDF or Excel.
- Date Range Selection: Choose specific date ranges for analysis.
3. DMI Summary Tab
Description:
The DMI Summary tab provides a detailed overview of daily Dry Matter Intake (DMI) for each pen across a selected date range. It aggregates DMI data for easy comparison and performance tracking.
Fields:
- Pen: Name of the pen.
- Dates (Columns): Daily DMI values for each date within the selected range.
- Average: The average DMI for the pen over the selected date range.
Use Case:
This report is essential for:
- Monitoring daily DMI trends for each pen.
- Ensuring animals are consuming adequate dry matter for optimal health and productivity.
- Comparing DMI performance across different pens over time.
Features:
- Filter by Pen: Focus on specific pens for detailed analysis.
- Export Options: Reports are downloadable in PDF or Excel formats.
- Date Range Selection: Customise the date range for the DMI summary.
General Features of the Reports
- Filters:
- Yesterday Tab & DMI Summary: Filter by pen.
- History Tab: Additional filter for grouping data.
- Export Options:
- Downloadable as PDF or Excel for all tabs.
- Customizable Date Ranges:
- Available in History and DMI Summary tabs to tailor data views.
When to Use These Reports
- Yesterday Tab:
- For quick daily reviews of feed performance and cost.
- Identifying immediate inefficiencies or issues.
- History Tab:
- For long-term trend analysis and strategic adjustments.
- Comparing data across multiple pens and dates.
- DMI Summary Tab:
- For in-depth tracking of dry matter intake trends.
- Evaluating the nutritional effectiveness of feeding programs.
How to Export Reports
- PDF Export: Click the PDF icon to download the report in PDF format.
- Excel Export: Click the Excel icon to export data into an editable Excel file.
Example view of the intake page