Mix Precision
Description
The Mix Precision page helps monitor and improve the accuracy of feed loading and ingredient mixing. It includes three tabs:
- Loading Accuracy Heatmap
- Loading Accuracy
- Deviation Value
Users can analyse data across operators, rations, feed plans, and time periods to identify inconsistencies and optimise processes.
Key Features
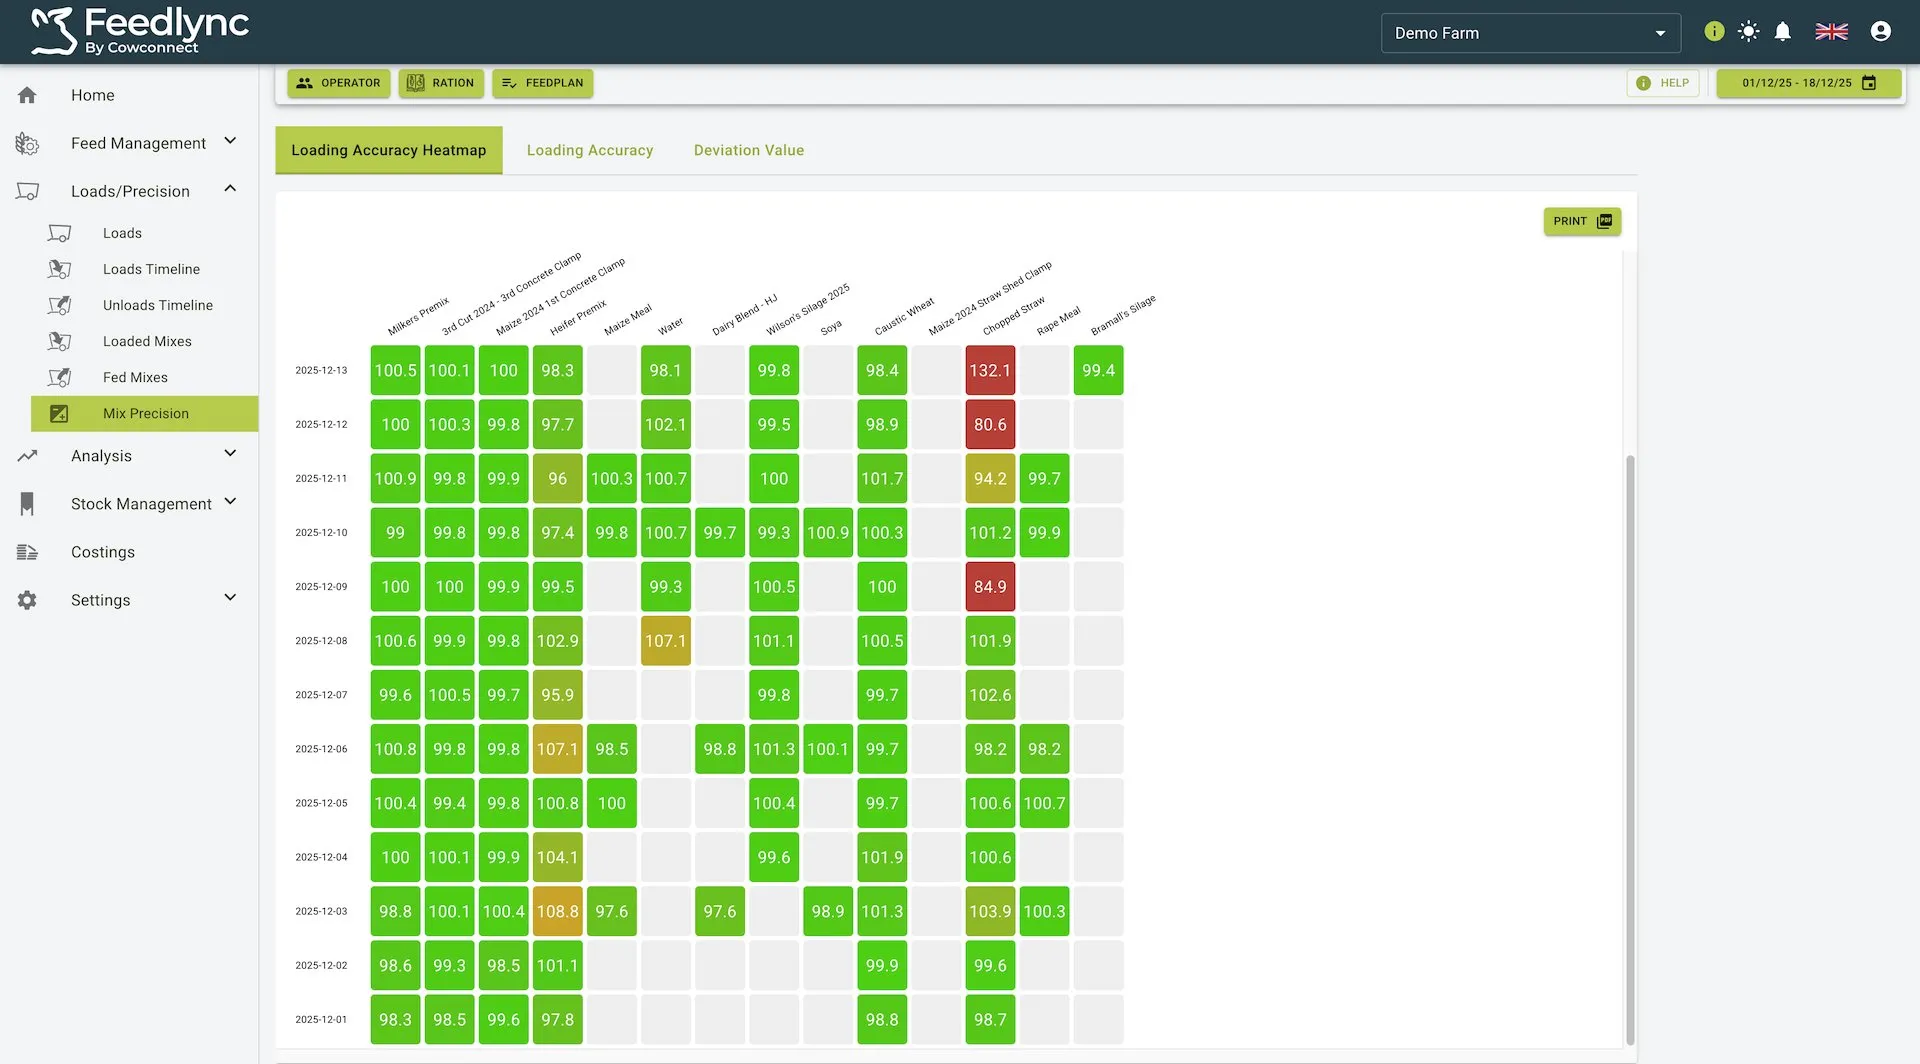
Loading Accuracy Heatmap
Main Features
- Visually represents loading accuracy for different ingredients across days in a heatmap format
- Includes interactive, clickable tiles that display detailed information when selected
- Uses color coding to indicate accuracy levels (green for high accuracy, yellow for moderate deviations, red for significant deviations)
- Provides filtering options by operator, ration, or feed plan
Loading Accuracy Heatmap View
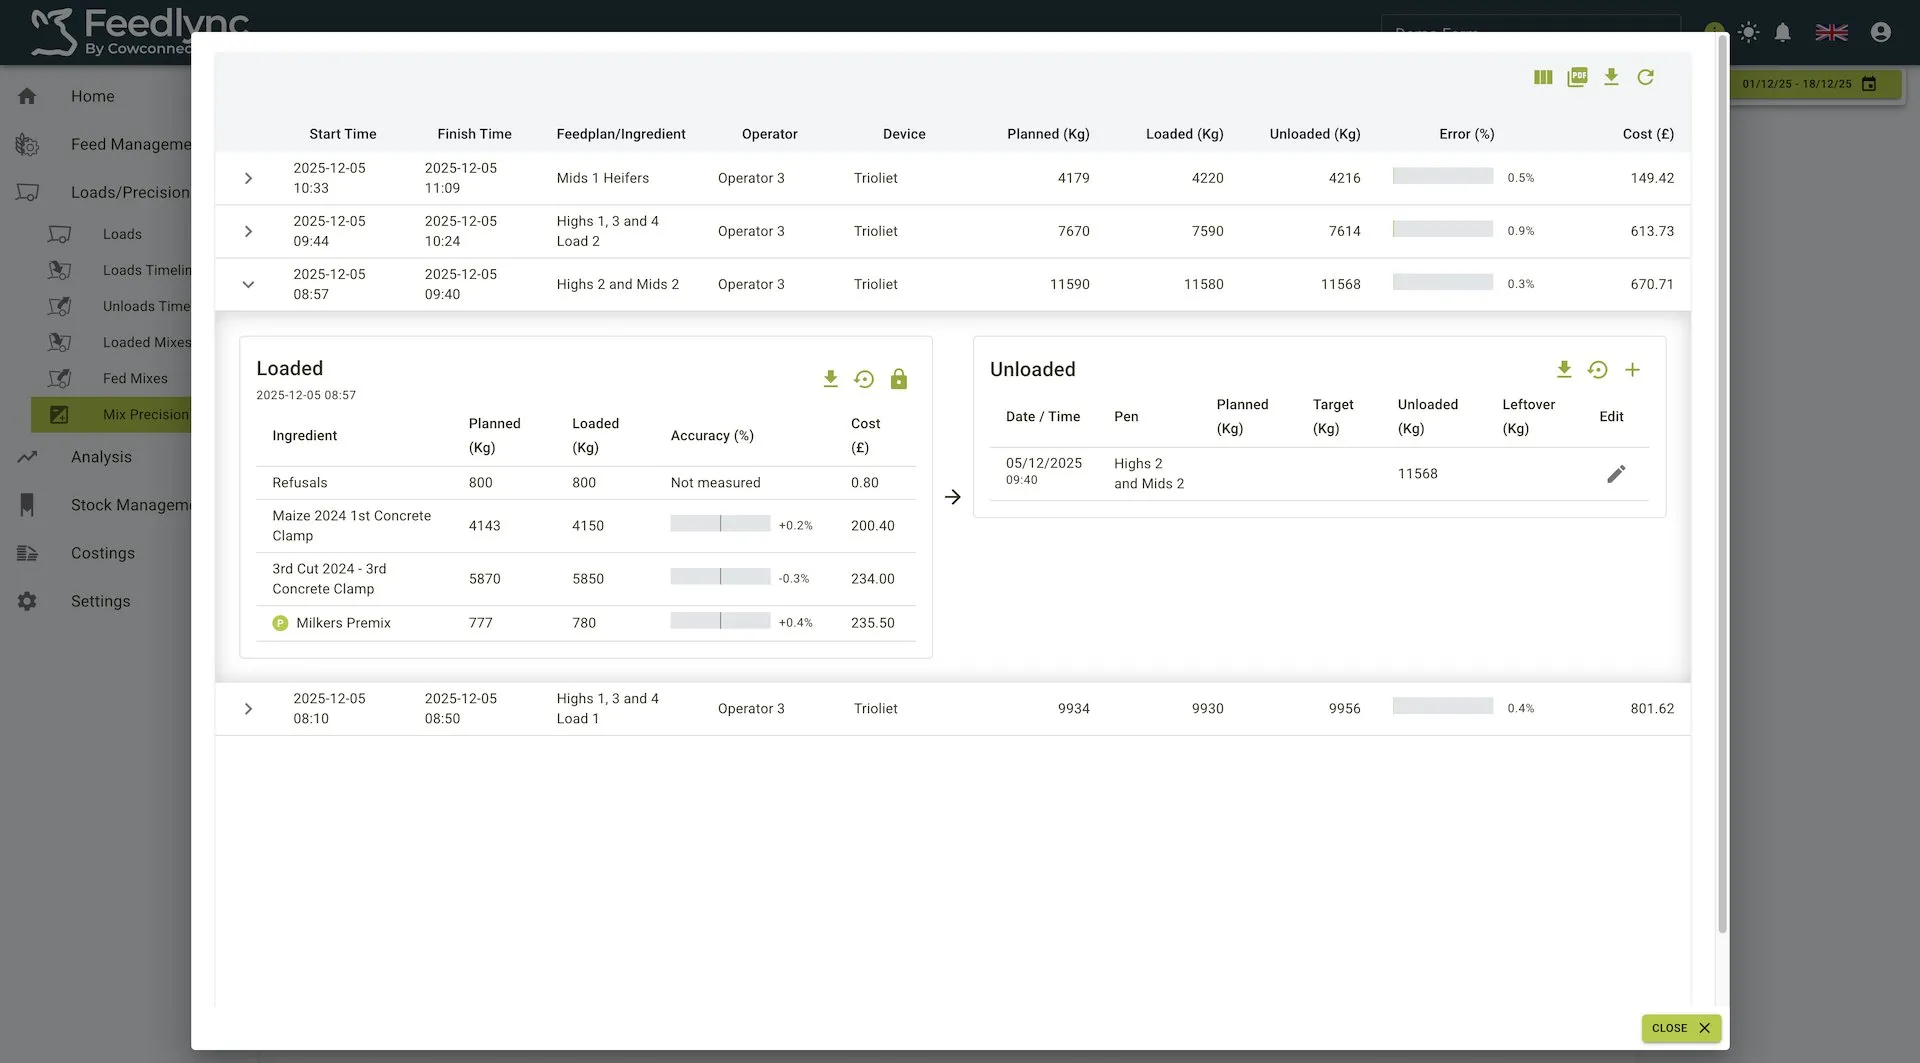
Interactive Tile Details
- Clickable Cells: Each coloured tile in the heatmap can be clicked to display detailed information
- Tile Dialog: When clicked, shows specific loading data for that ingredient on that particular day
- Detailed Metrics: Includes planned weight, actual loaded weight, deviation percentage, and timestamp
Tile Dialog When Clicked
Additional Functionality
- Date Range Selector: Adjust the time period for the displayed data
- Print Option: Generate a printable version of the heatmap for reporting
- Color-Coded Legend: Helps interpret accuracy levels at a glance
- Green: Within acceptable limits (typically ±5%)
- Yellow: Minor deviations (typically ±5-10%)
- Red: Significant deviations (typically >10%)
Loading Accuracy
Main Features
- Displays a bar chart representation of loading accuracy for each ingredient
- Shows error percentages on the horizontal axis (both positive and negative)
- Uses color coding for bars (green for accurate or slightly underloaded, red for overloaded ingredients)
- Provides filtering and sorting capabilities
Loading Accuracy View
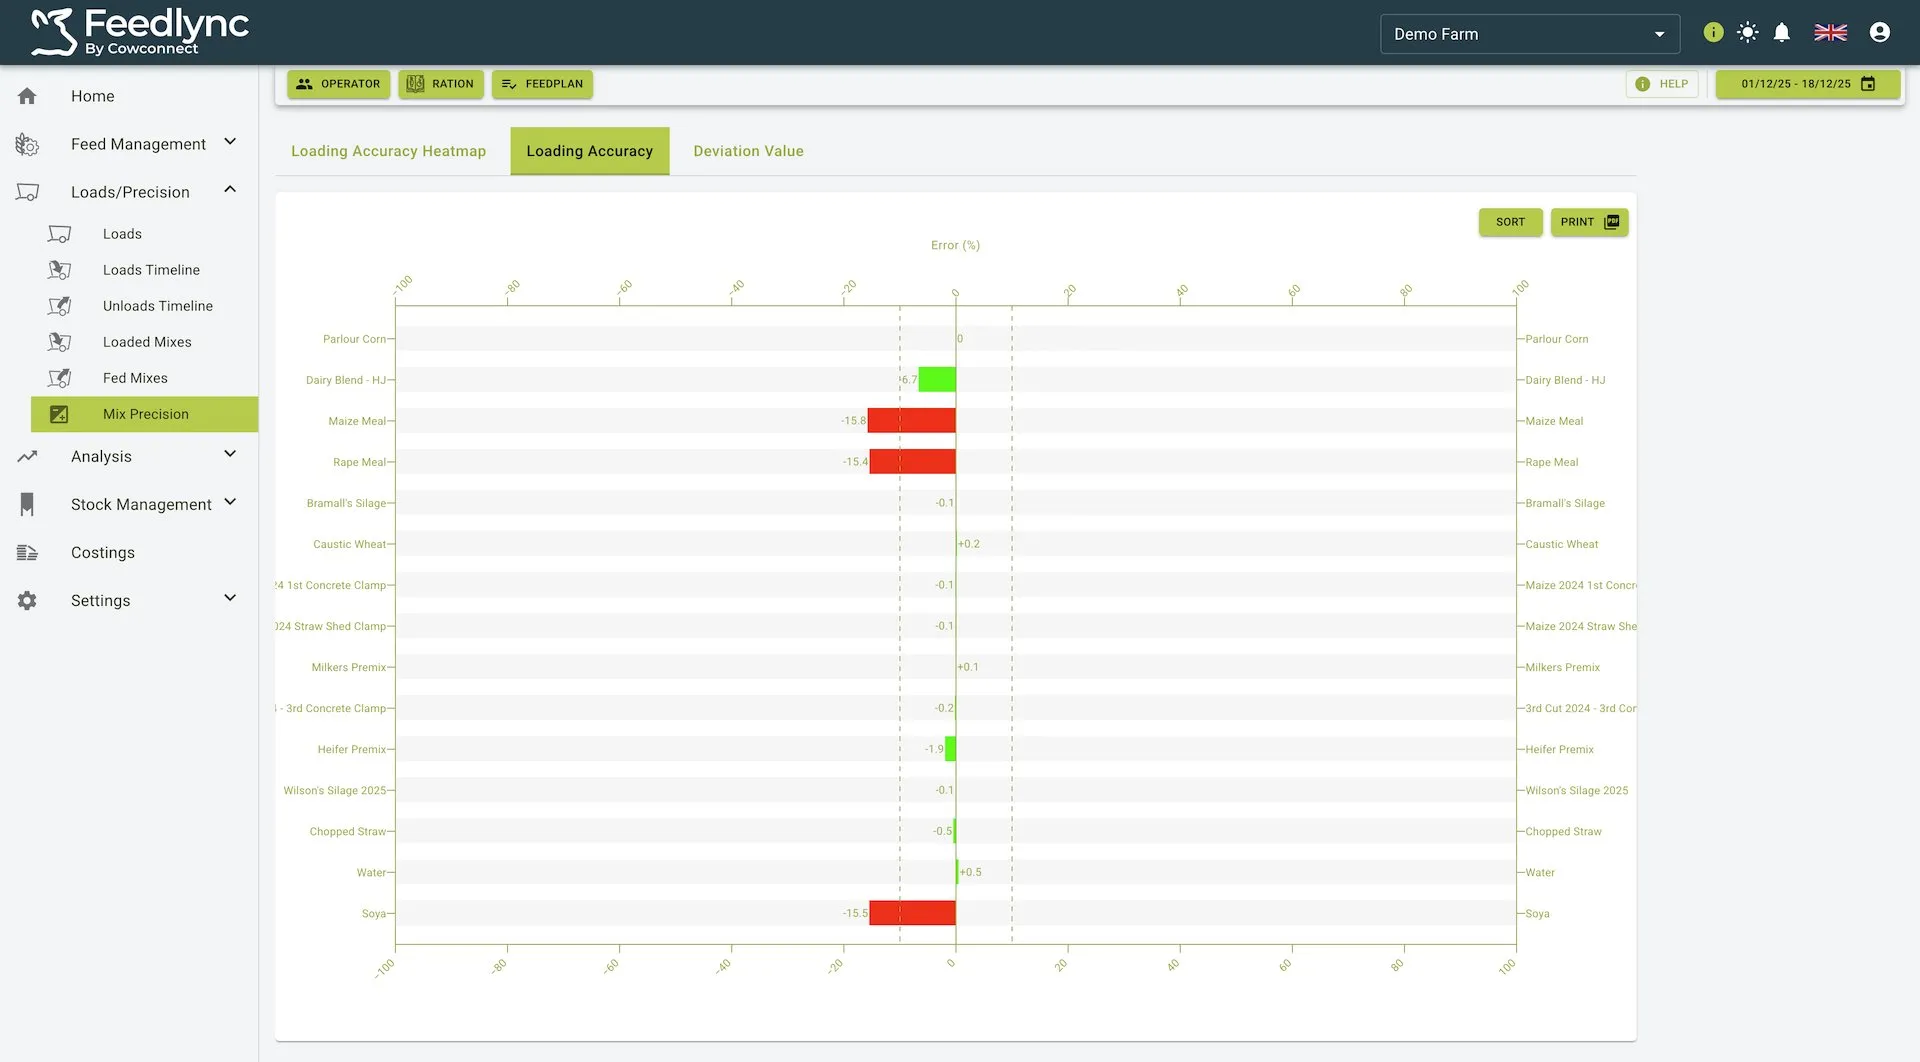
Key Elements
- Error Percentage Display: Clearly shows how far actual loading deviates from planned amounts
- Ingredient List: Lists all ingredients used in selected feeds
- Visual Indicators:
- Green bars indicate accurate loading or slight underloading
- Red bars indicate overloading which may affect feed quality and costs
Additional Controls
- Sort Option: Arrange ingredients by error percentage for quick analysis
- Print Button: Export the chart data for reporting and further analysis
- Filtering Controls: Narrow analysis by operator, ration, or feed plan
Deviation Value
Main Features
- Highlights the financial impact of loading deviations
- Shows both error percentage and associated cost for each ingredient
- Uses color-coded bars to indicate cost impact (green for savings/minimal impact, red for increased costs)
- Provides detailed cost calculations for accurate financial analysis
Deviation Value View
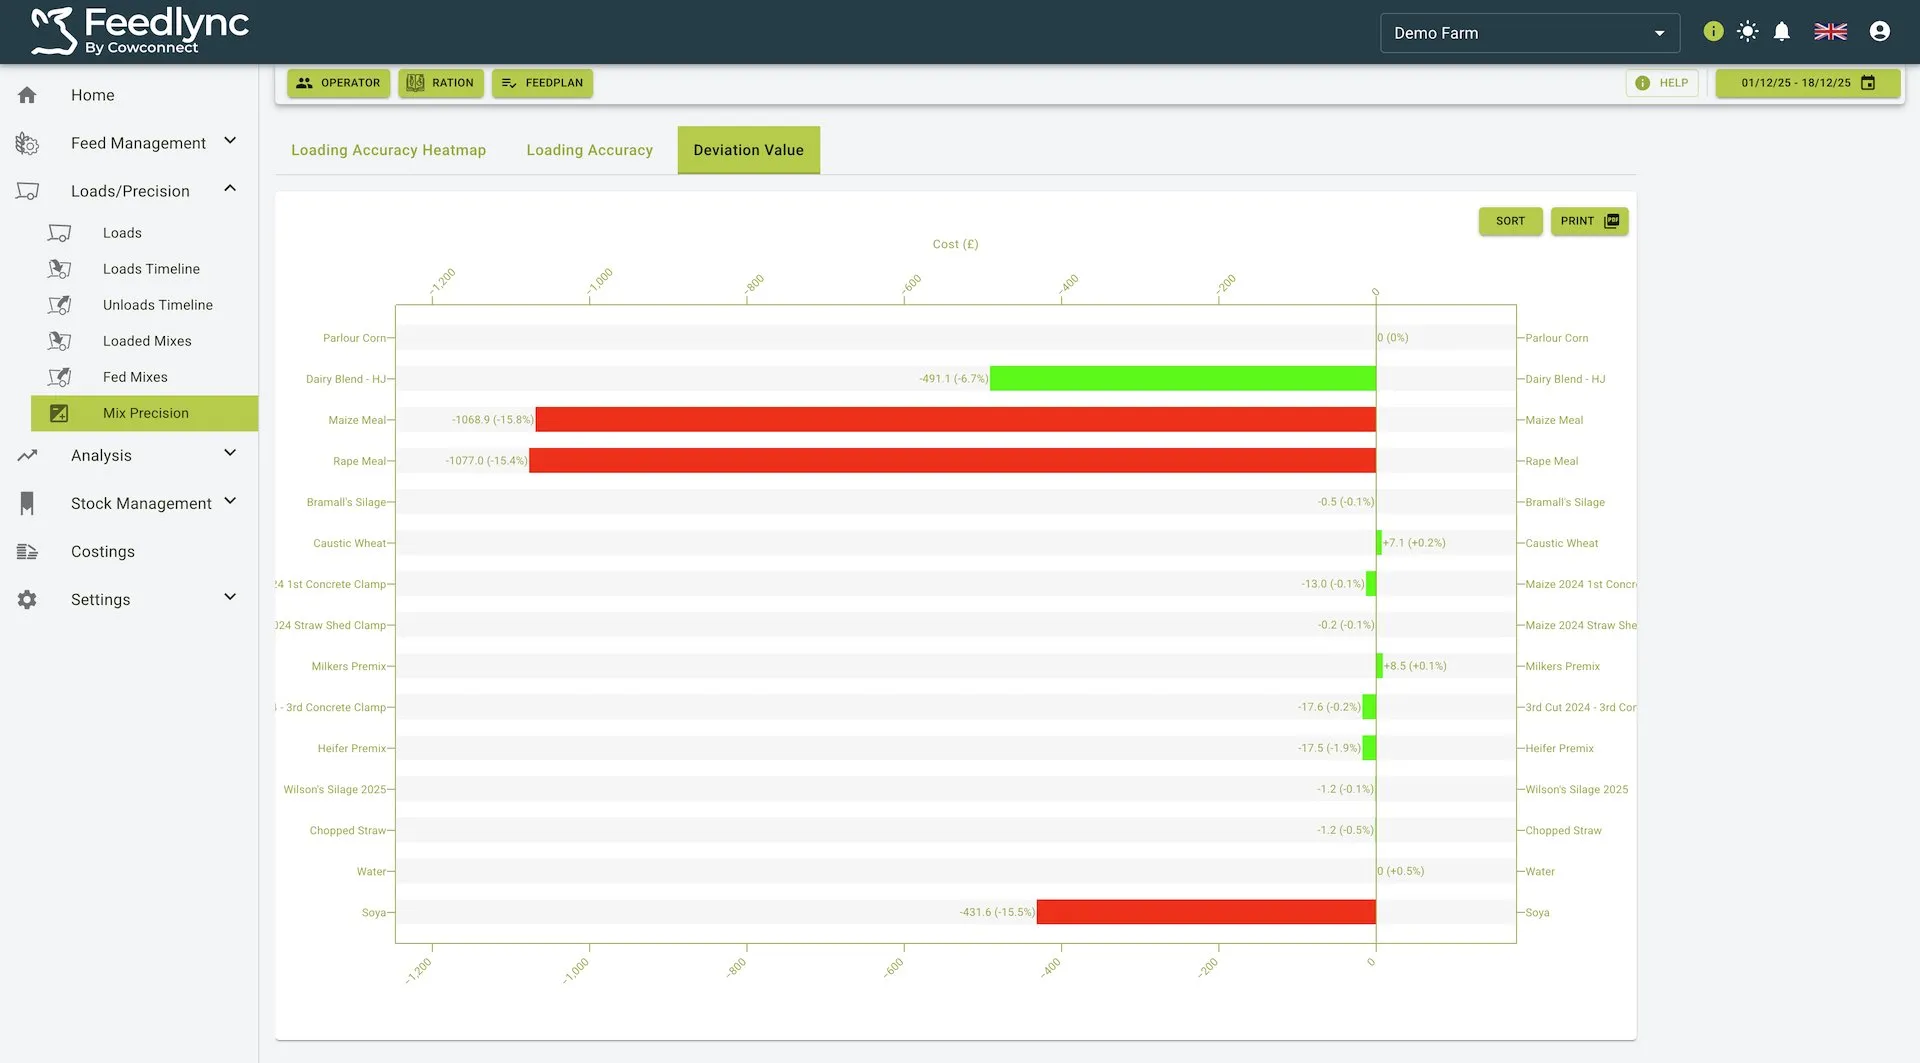
Key Metrics
- Cost Impact: Shows the financial effect of over or under-loading in euros
- Error Percentage: Displays deviation from planned loading amounts
- Ingredient-Specific Analysis: Breaks down costs by individual ingredients
- Visual Representation:
- Length of bar indicates magnitude of cost impact
- Color indicates whether the deviation increased costs (red) or had minimal impact (green)
Analysis Tools
- Sort Feature: Arrange ingredients by deviation value for cost prioritization
- Print Option: Generate reports for financial analysis and planning
- Hover Details: View precise cost figures by hovering over individual bars
Menu and Navigation Features
- Filters:
- Operator: View data specific to individual operators
- Ration: Filter data based on specific rations
- Feed Plan: Select specific feed plans to analyse
- Date Range Selector: Limit analysis to specific time periods
- Export Options: All tabs support exporting data as reports
Practical Use Cases
Performance Monitoring
- Compare accuracy across different operators to identify training needs
- Track improvements over time after implementing new procedures
- Recognize patterns in loading errors related to specific ingredients or times of day
Cost Management
- Identify ingredients with the highest financial impact when loading deviations occur
- Calculate the actual cost of loading inaccuracies across the operation
- Prioritize improvements based on financial impact rather than percentage error alone
Process Optimization
- Analyze which ingredients are consistently challenging to load accurately
- Determine if specific rations or feed plans show higher error rates
- Use the heatmap to identify days or periods with unusual deviation patterns
- Monitor the effectiveness of mixer wagon calibration through improved accuracy metrics
Quality Control
- Ensure consistent feed quality by monitoring loading precision
- Maintain nutritional accuracy by keeping ingredients within acceptable deviation ranges
- Track trends to proactively address declining accuracy before it affects animal performance
Summary
The Mix Precision feature provides comprehensive tools for analysing and improving feed loading accuracy. Through its three interactive views:
- The Loading Accuracy Heatmap offers a visual calendar view of accuracy trends with clickable tiles for detailed information
- The Loading Accuracy tab presents a clear percentage-based view of loading precision for each ingredient
- The Deviation Value tab translates accuracy issues into financial terms for cost-focused decision making
These tools collectively enable farms to maintain consistent feed quality, control costs, identify training opportunities, and optimize their feeding operations through data-driven insights.