Physical Data
Description
The Physical Data section of the software provides seven detailed tabs, enabling users to monitor key metrics like milk yield, cow numbers, dry matter intake, and more. The data can be viewed in both tabular and graphical formats, with options for exporting reports as printed graphs or tables. A date filter allows users to specify time periods for analysis.
Key Features
Milk Yield
Main Features
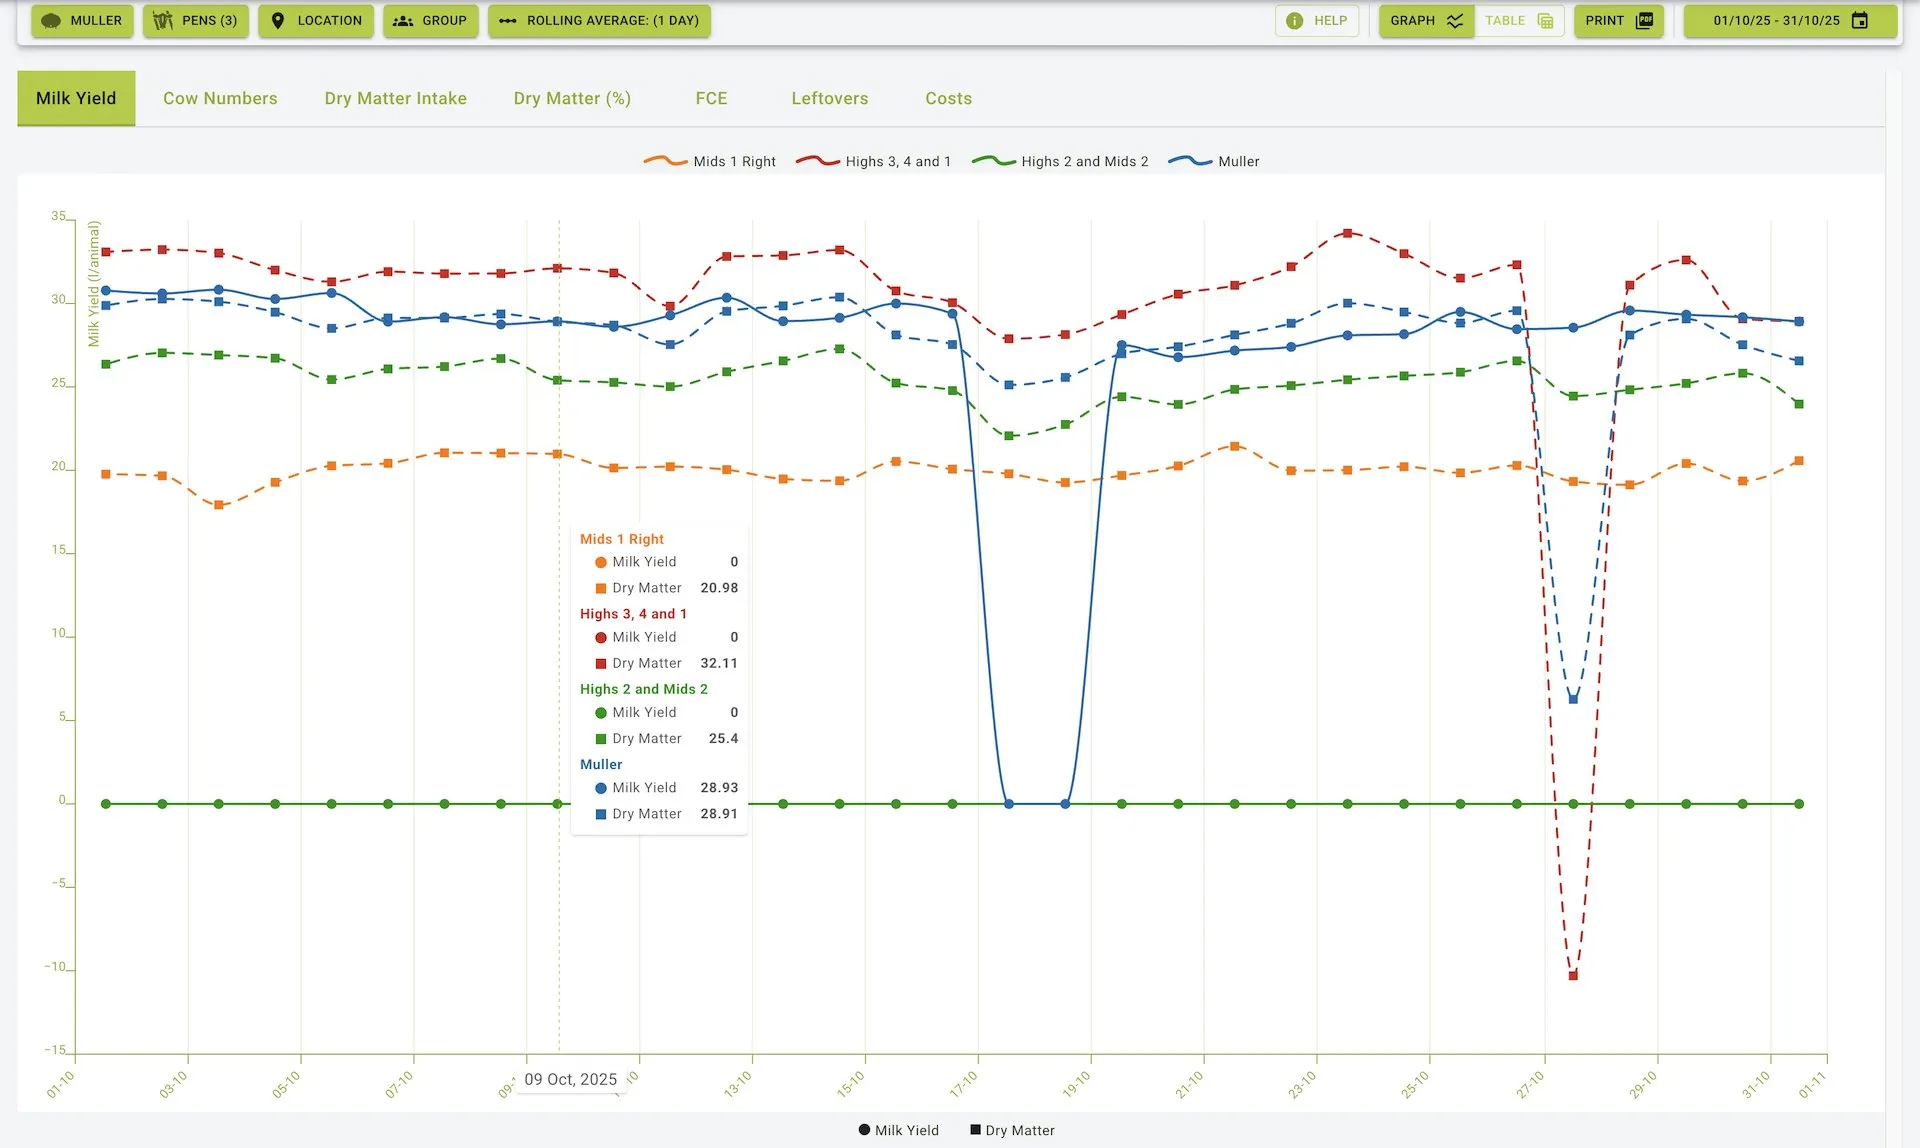
- Displays the average milk yield per animal for each date in the selected date range
- Shows dry matter per animal alongside yield figures
- Provides both tabular and graphical views of the data
- Allows date range filtering for targeted analysis
Key Data Fields
- Date: The specific date of the record
- Yield / Animal: The average milk yield per animal (in litres or kilograms)
- DM/Animal: The average dry matter per animal
Milk Yield Tab View
Use Cases
- Monitor daily milk production trends
- Compare milk yields across different dates to identify potential issues or improvements in production
- Assess the impact of feed or environmental changes on milk production
- Correlate milk yield with dry matter intake to optimize feeding strategies
Cow Numbers
Main Features
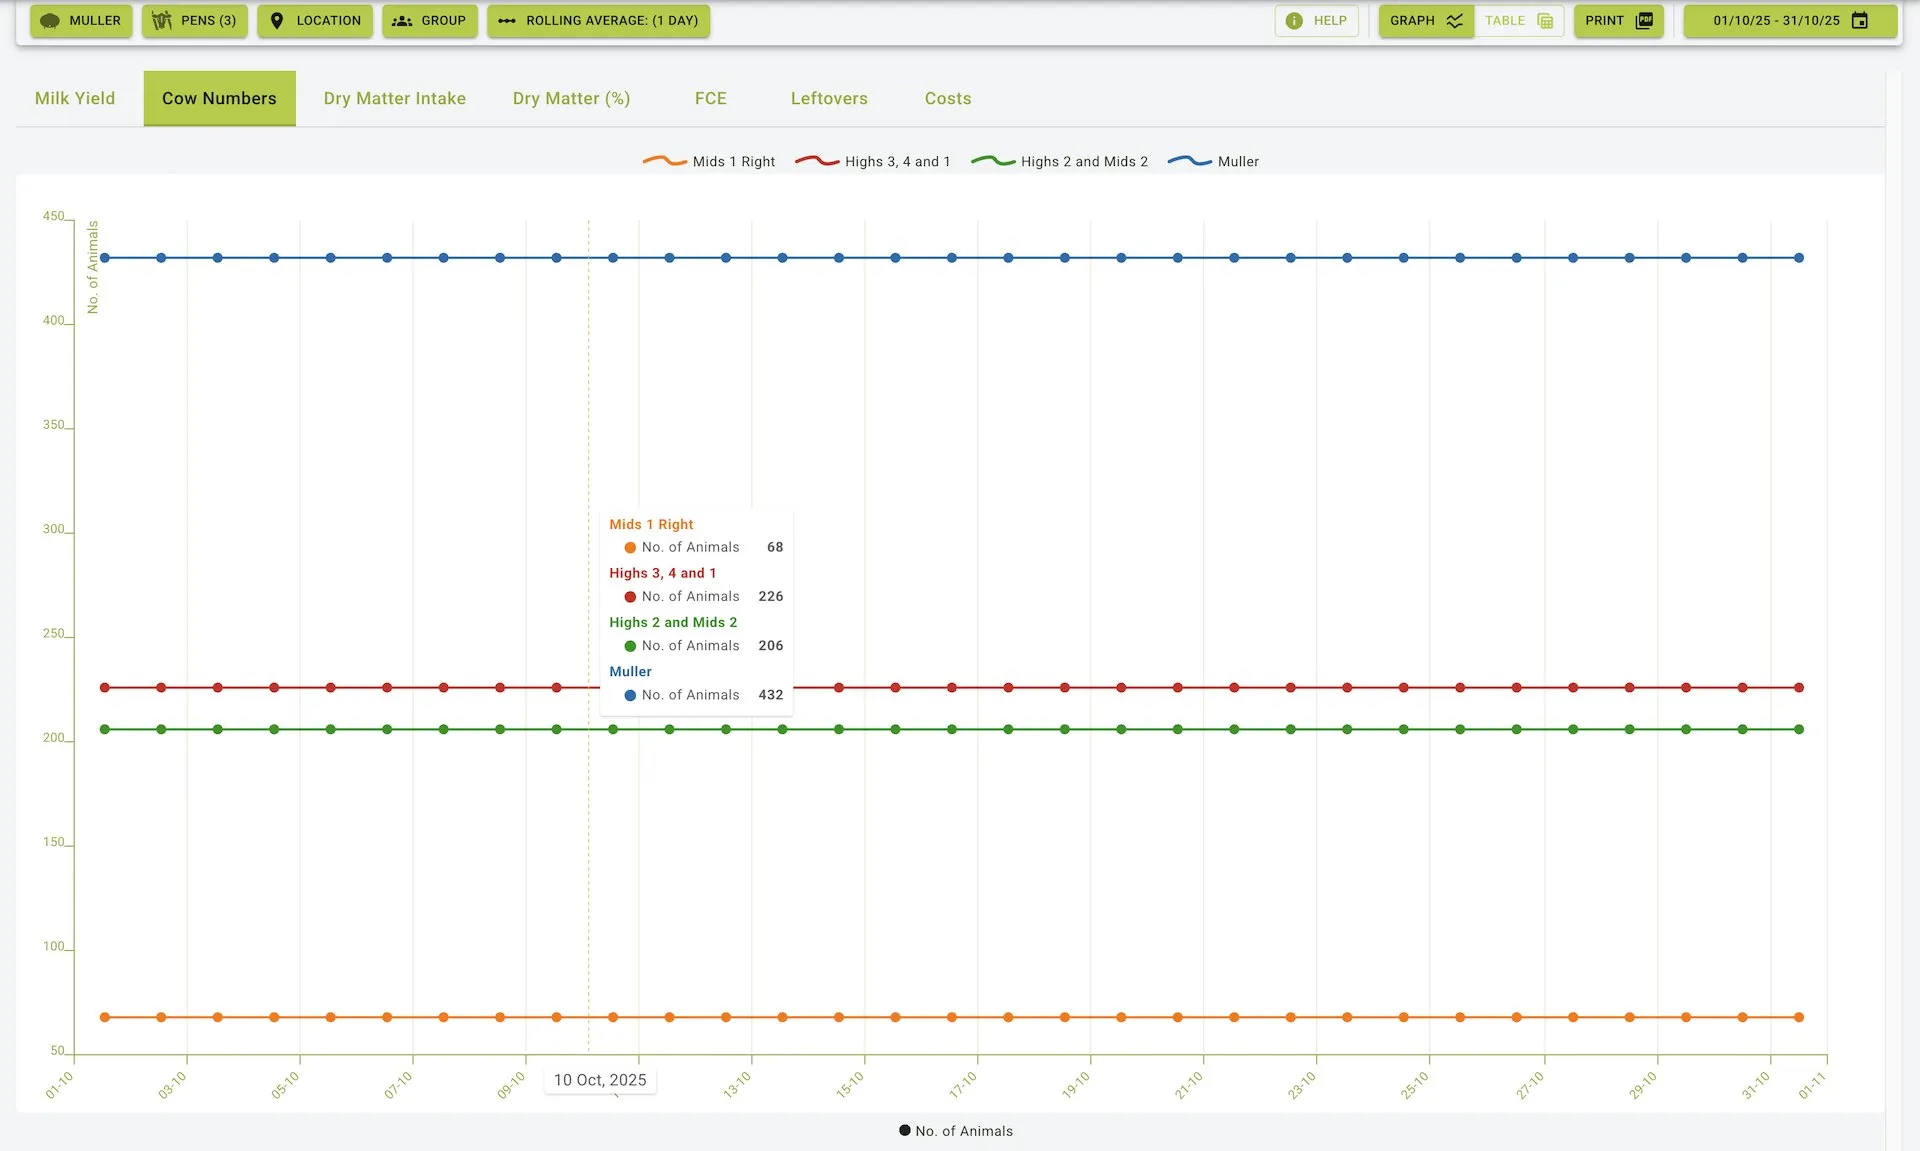
- Tracks the total number of cows present on each date within the selected range
- Provides visual representation of herd size changes over time
- Supports date filtering to focus on specific periods
- Displays data in both tabular and graphical formats
Key Data Fields
- Date: The specific date of the record
- Number of Animals: The total number of cows recorded for that day
Cow Numbers Tab View
Use Cases
- Track changes in herd size over time
- Use alongside other metrics like milk yield and feed intake for performance evaluation
- Verify accuracy of recorded herd data
- Plan resource allocation based on herd size patterns
Dry Matter Intake
Main Features
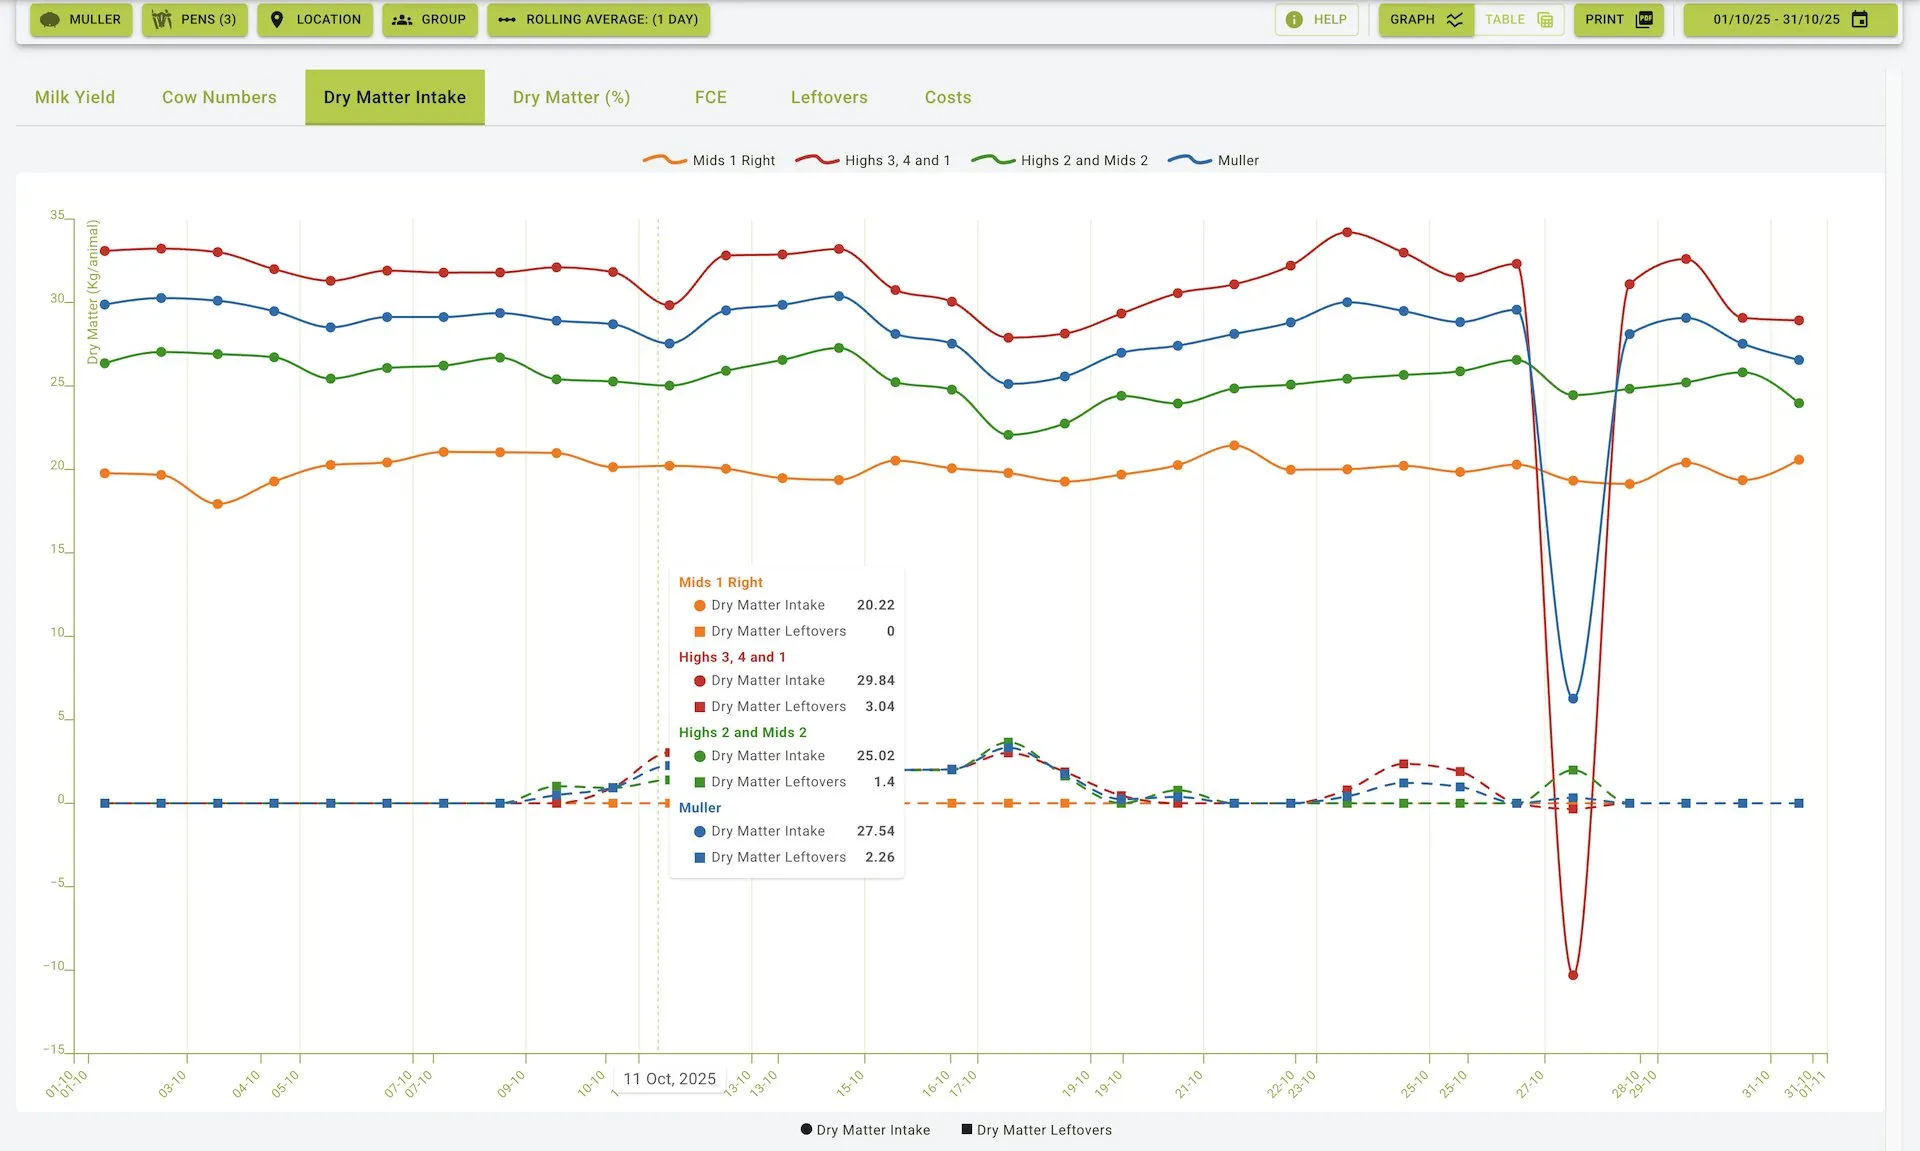
- Shows the daily dry matter intake (DMI) per animal for each date
- Tracks dry matter leftover per animal
- Visualizes intake trends through graphical representation
- Allows filtering by date range for targeted analysis
Key Data Fields
- Date: The specific date of the record
- Dry Matter Intake (DM/Animal): The average dry matter intake per animal
- Dry Matter Leftover (DM/Animal): The average dry matter leftover per animal
Dry Matter Intake Tab View
Use Cases
- Evaluate whether cattle are consuming sufficient dry matter for optimal productivity and health
- Correlate DMI with milk yield or other performance metrics
- Identify feeding pattern changes that may indicate health issues
- Adjust feeding strategies based on consumption and leftover patterns
Dry Matter (%)
Main Features
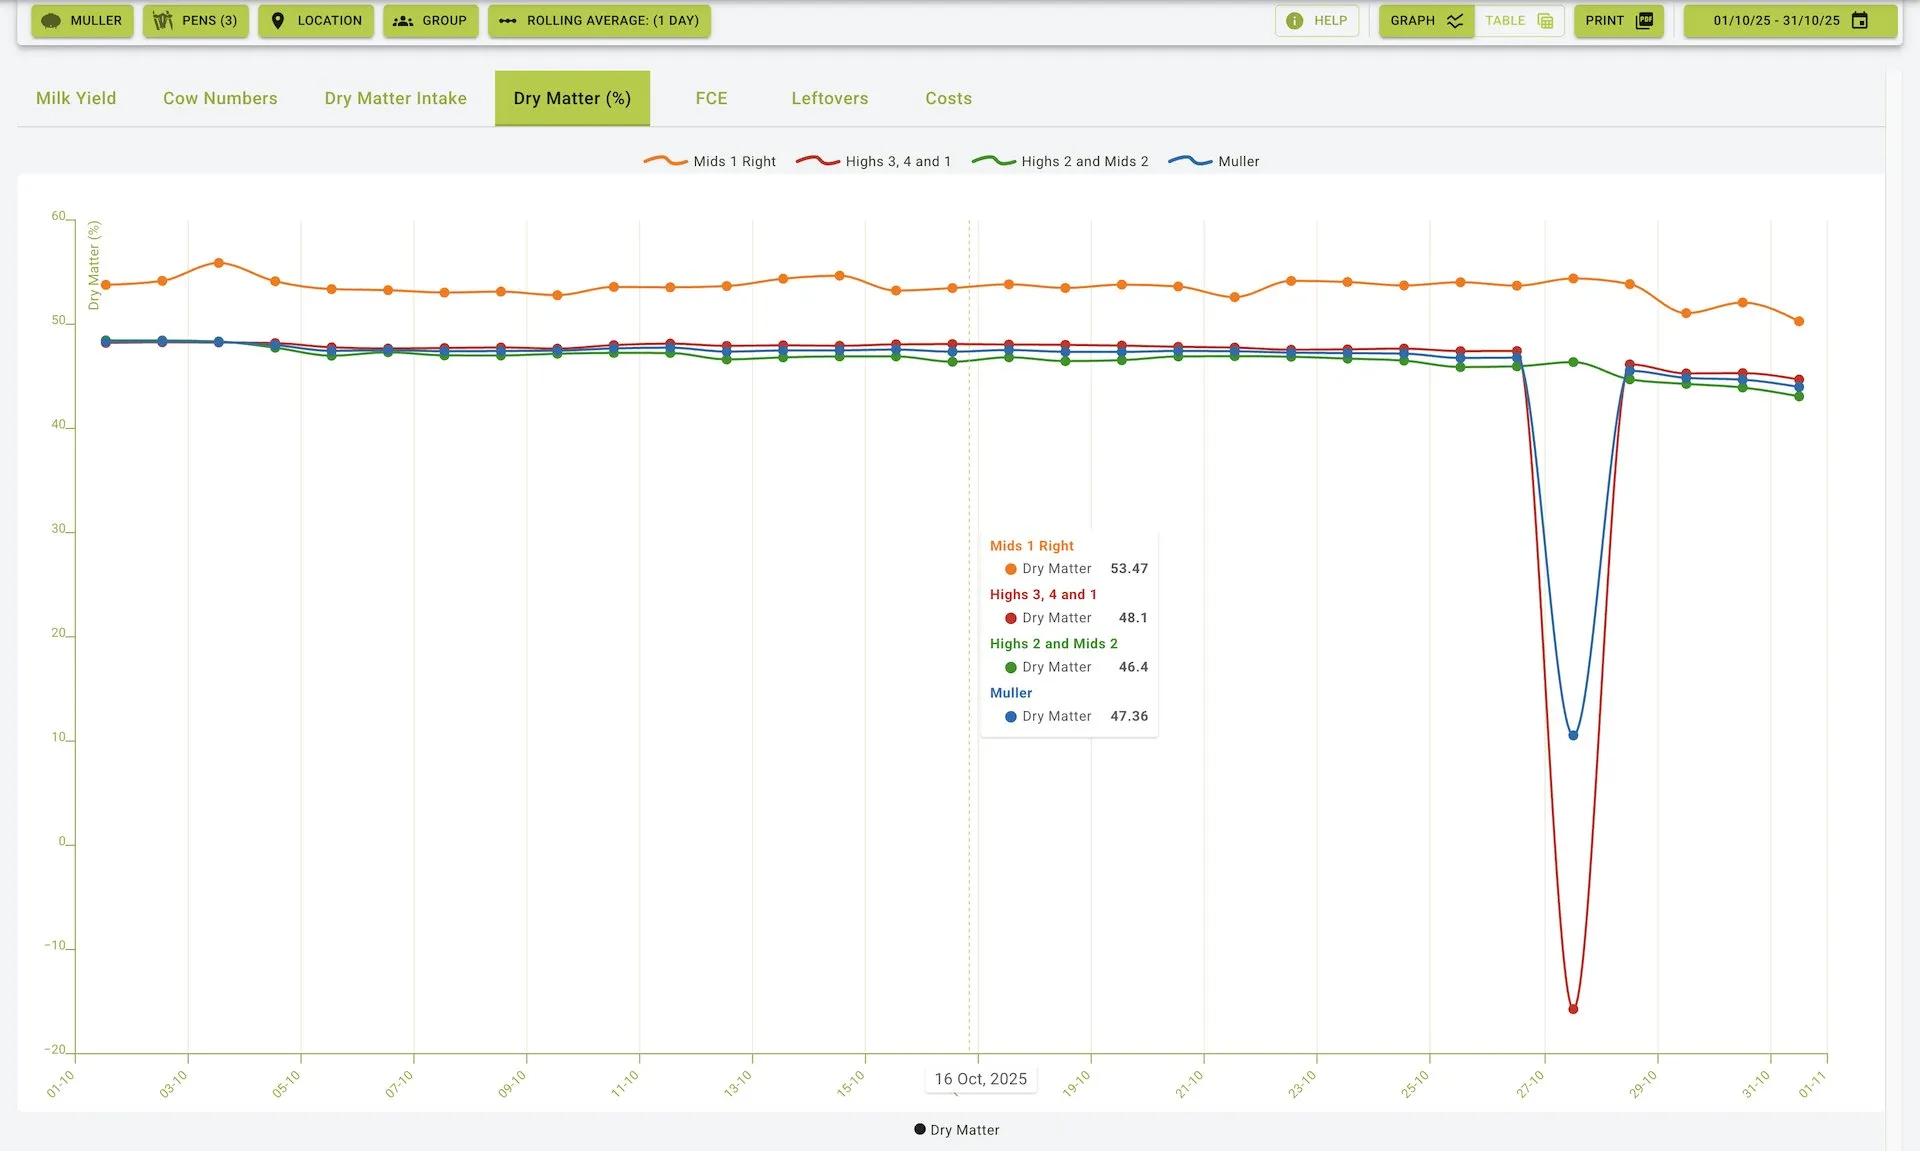
- Calculates and displays the percentage of dry matter in the feed for each date
- Presents data in both tabular and graphical formats
- Supports date range filtering for focused analysis
- Helps track feed quality consistency over time
Key Data Fields
- Date: The specific date of the record
- Dry Matter (%): The percentage of dry matter in the feed
Dry Matter (%) Tab View
Use Cases
- Ensure feed quality consistency
- Compare feed compositions and their effects on productivity
- Adjust feeding strategies based on dry matter percentages
- Monitor seasonal variations in feed moisture content
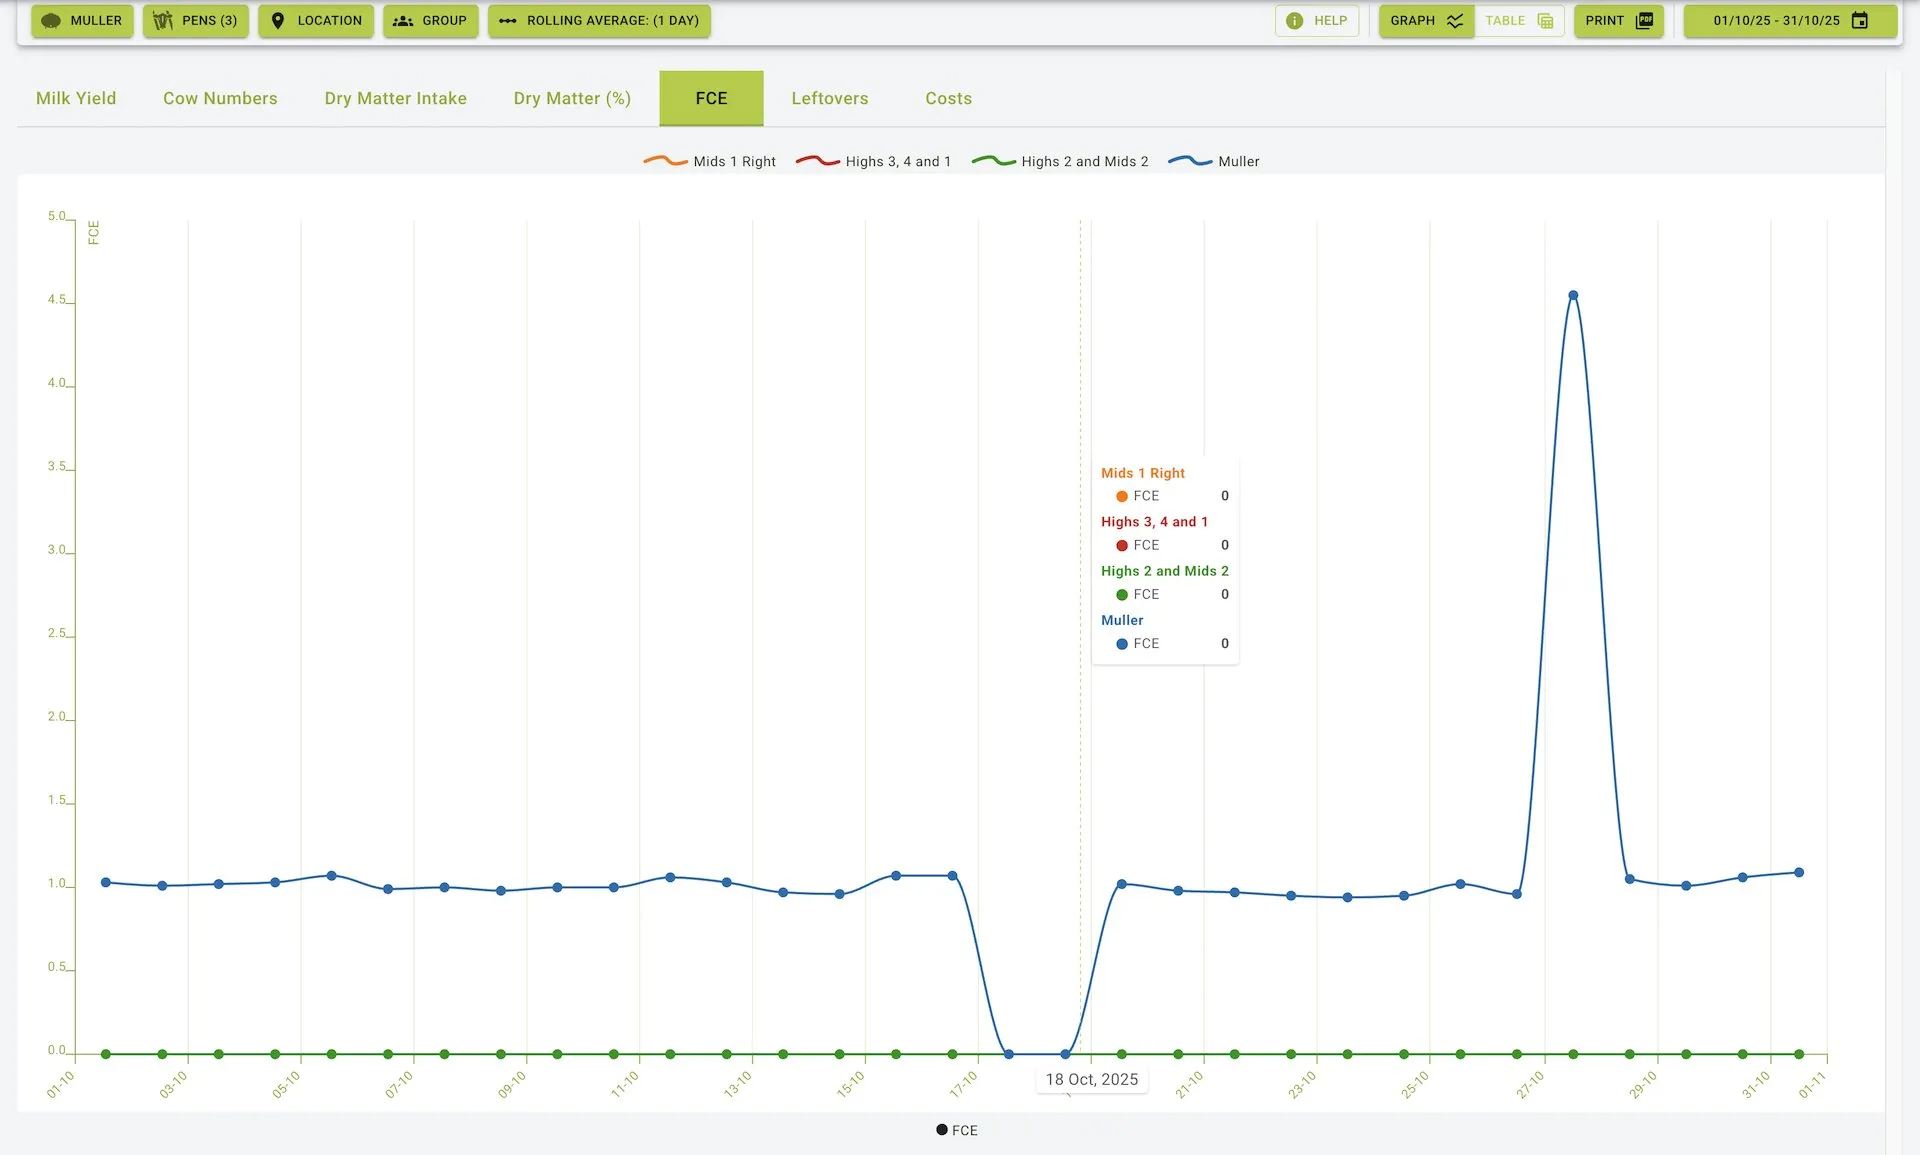
Feed Conversion Efficiency (FCE)
Main Features
- Measures feed conversion efficiency, showing how effectively feed is being converted into milk production
- Provides both tabular and graphical visualization of FCE trends
- Supports date filtering for period-specific analysis
- Helps identify optimal feeding strategies
Key Data Fields
- Date: The specific date of the record
- FCE: Feed Conversion Efficiency value
FCE Tab View
Use Cases
- Monitor the efficiency of feeding programs
- Identify opportunities to improve feed utilization
- Correlate with cost and yield metrics for strategic adjustments
- Compare FCE across different seasons or feeding regimens
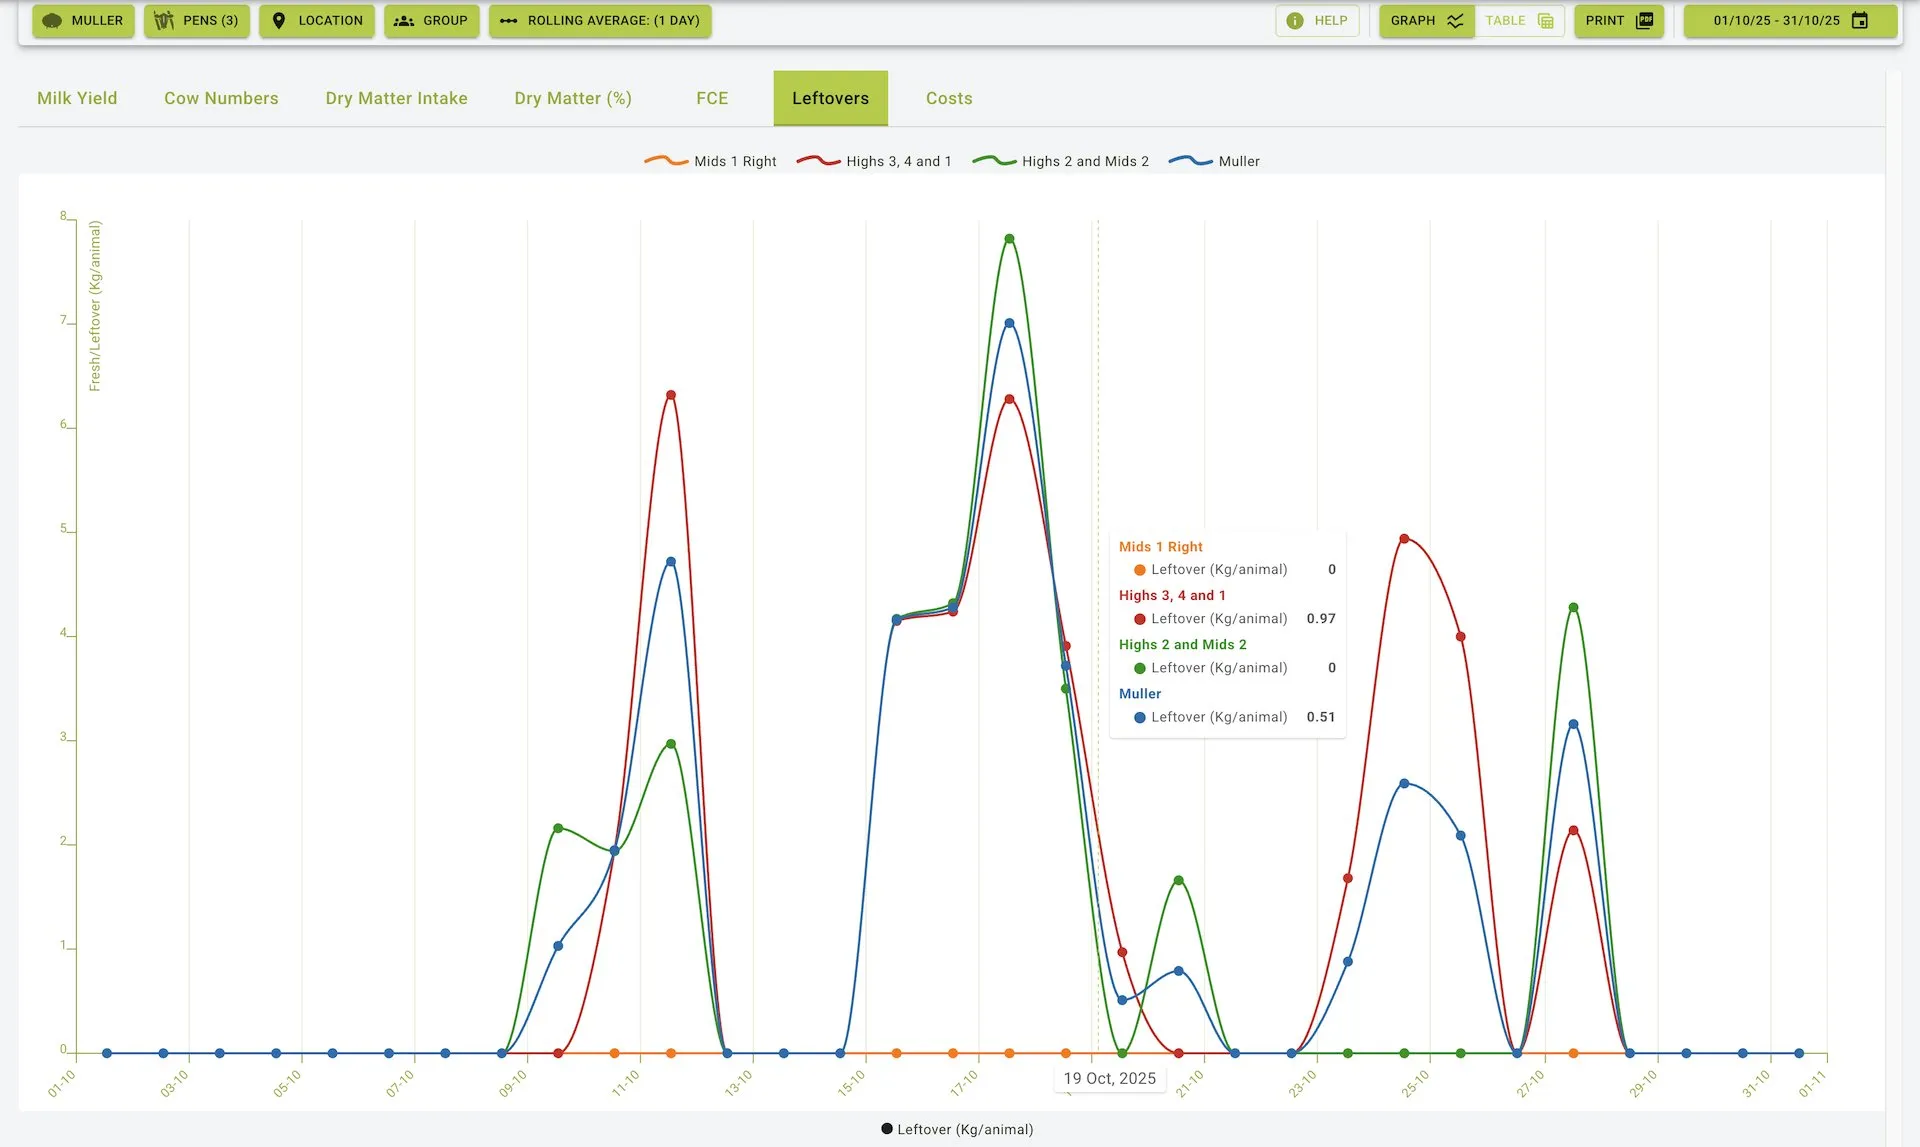
Leftovers
Main Features
- Provides data on leftover feed for each date, expressed in kilograms per animal
- Visualizes leftover patterns through graphical representation
- Supports date filtering for targeted analysis
- Helps identify potential waste and feeding inefficiencies
Key Data Fields
- Date: The specific date of the record
- Leftover (Kg/Animal): The average leftover feed per animal
Leftovers Tab View
Use Cases
- Minimize feed wastage
- Evaluate feeding practices to ensure optimal quantities are being provided
- Identify over- or under-feeding issues
- Adjust portion sizes based on consistent leftover patterns
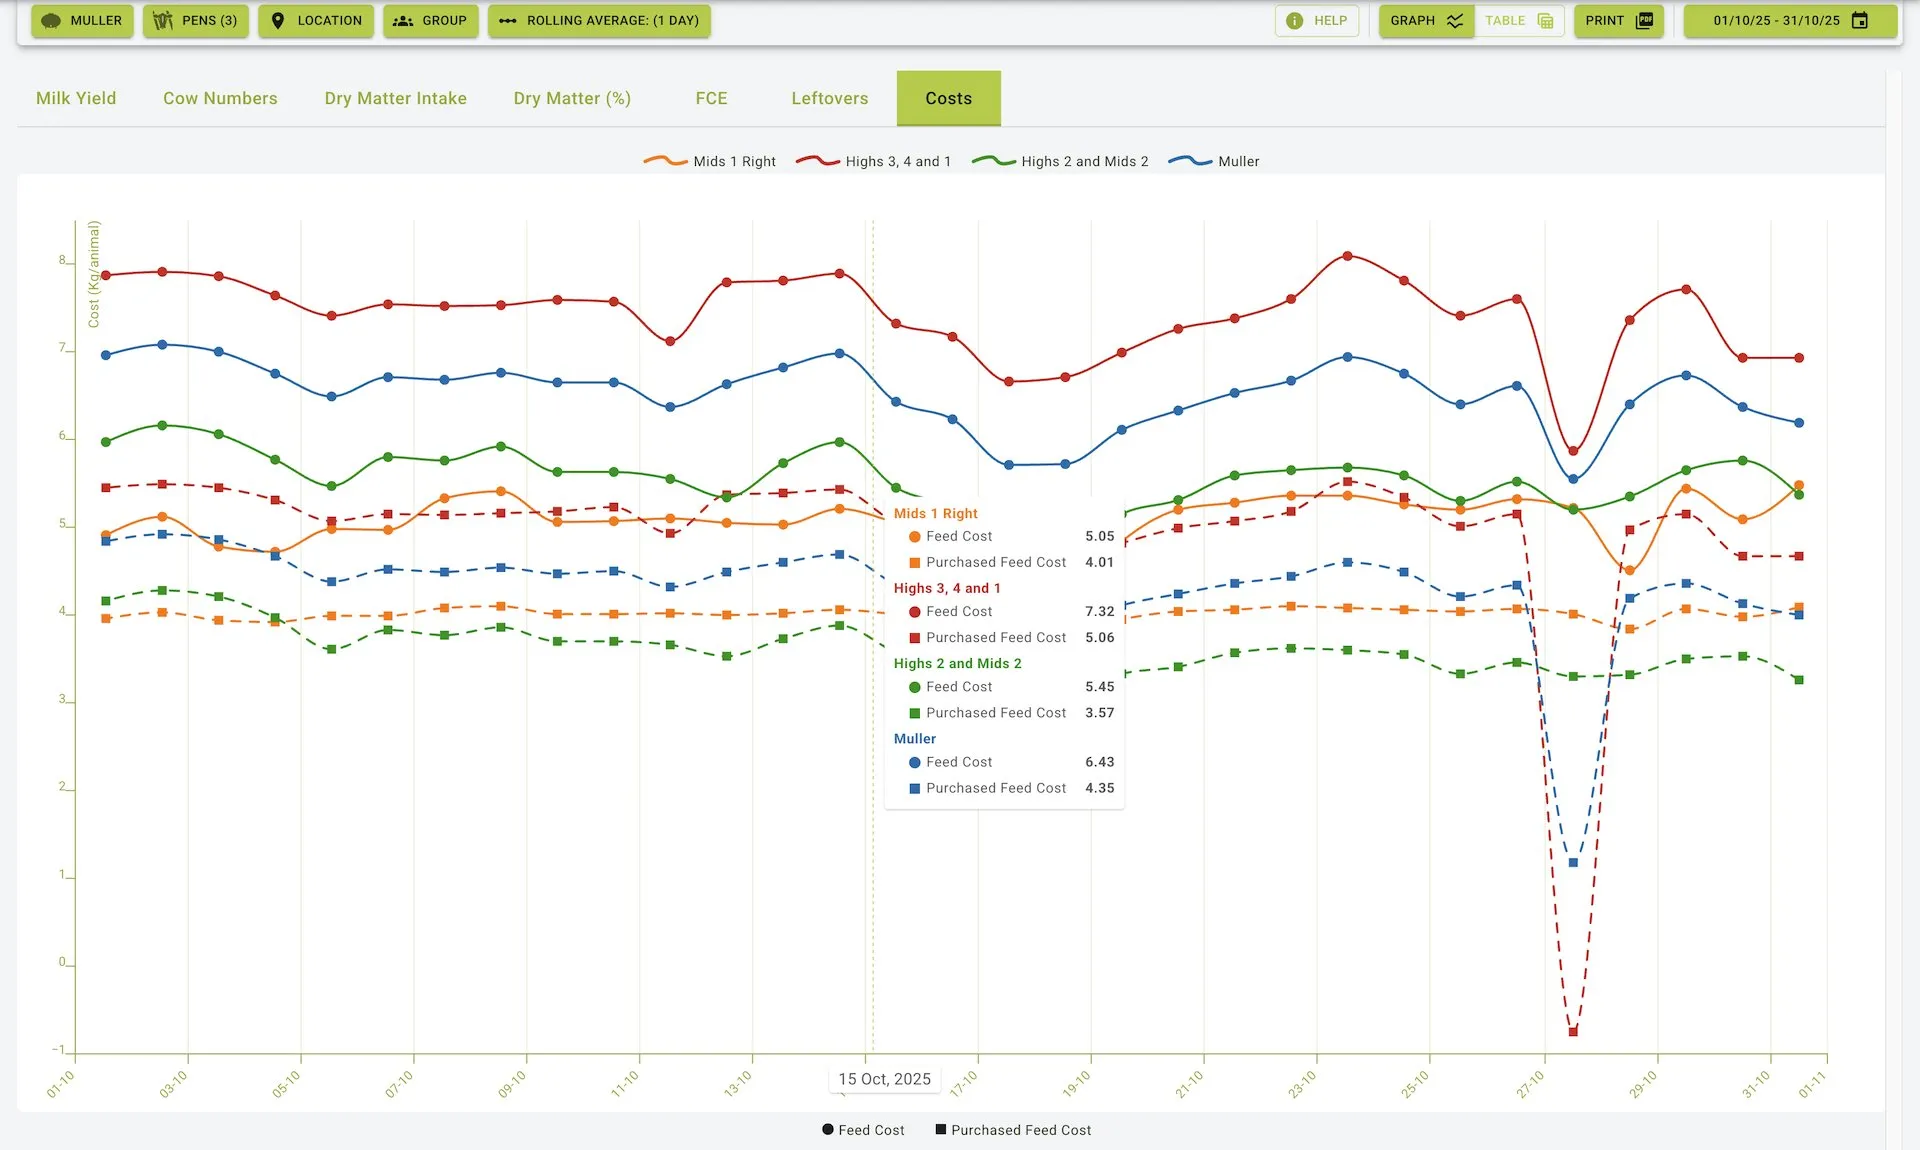
Costs
Main Features
- Shows feed costs, including total and purchased feed costs, for each date
- Presents cost data in both tabular and graphical formats
- Supports date filtering for period-specific analysis
- Helps track and manage feed expenses over time
Key Data Fields
- Date: The specific date of the record
- Feed Cost: Total feed cost for the day
- Purchased Feed Cost: Cost of purchased feed for the day
Costs Tab View
Use Cases
- Track and manage feed expenses
- Compare costs with milk yield or DMI to calculate profitability
- Assess the economic efficiency of feeding strategies
- Identify cost-saving opportunities in feed management
Filter Options
- Bulk Tank: Select a specific bulk tank
- Pens and Groups: Filter data by specific pens or groups of pens to analyse their performance separately.
- Rolling Average:
- Options include 1-day, 3-day, and 7-day averages.
- What is a Rolling Average?
- A rolling average smooths out short-term fluctuations in the data, providing a clearer view of trends over time.
- For example, a 3-day rolling average calculates the average value over the last three days for each date, helping to identify consistent patterns without the noise of daily variations.
Practical Use Cases
Data-Driven Farm Management
- Analyze milk yield trends to identify production patterns and anomalies
- Monitor feed conversion efficiency to optimize nutritional strategies
- Track cow numbers alongside performance metrics for accurate per-animal analysis
- Compare dry matter intake with milk production to evaluate feeding efficiency
Cost Management and Optimization
- Monitor daily feed costs and correlate with production metrics
- Identify cost fluctuations related to seasonal or market changes
- Calculate feed cost per litre of milk produced for profitability analysis
- Analyze purchased feed costs as a percentage of total feed expenses
Nutritional Management
- Track dry matter intake to ensure optimal nutrition
- Monitor feed conversion efficiency to evaluate feed quality and formulation
- Use leftover data to adjust feeding quantities and reduce waste
- Analyze dry matter percentage to ensure consistent feed quality
Performance Tracking
- Compare current performance with historical data to identify trends
- Evaluate the impact of feed changes on milk yield and efficiency
- Track seasonal variations in performance metrics
- Generate reports for management review and decision-making
General Features
Data Visualization Options
- Graphical View: Data from all seven tabs can be visualized in graph format for easier trend analysis
- Table View: Detailed data is presented in tabular format for precise numerical analysis
- Date Filters: Allows users to specify time ranges for focused data analysis
- Print Options: Graphs and tables can be exported as printable reports
Navigation and User Interface
- Intuitive tab-based navigation between different metrics
- Consistent presentation of date-based data across all reports
- Interactive graphs with hover details for specific data points
- Flexible date range selection for customized reporting periods
Summary
The Physical Data feature serves as a comprehensive analytical tool for monitoring and optimizing farm performance. With its seven specialized tabs (Milk Yield, Cow Numbers, Dry Matter Intake, Dry Matter Percentage, FCE, Leftovers, and Costs), it enables users to:
- Track key performance indicators related to production and efficiency
- Monitor feed consumption, quality, and conversion rates
- Analyze cost structures and identify optimization opportunities
- Support data-driven decision-making through visual and tabular representations
By providing detailed historical data and trend analysis, the Physical Data feature helps farm operations improve productivity, optimize nutrition strategies, and enhance overall profitability.