Nutrient Data
Description
The Nutrient Data page provides comprehensive analysis of feed nutrients over time. It allows users to monitor and track key nutritional components across different feed sources and locations. The page features interactive graphs that display data for multiple feed types simultaneously, making it easy to compare and analyze nutrient trends. Users can select specific date ranges, feed sources, and locations to customize their analysis.
Key Features
Energy
Main Features
- Displays energy content data across different feed sources
- Shows detailed trends of key components: CP, Oil, and Starch
- Allows for comparison between different feed locations
- Provides time-series visualization for tracking changes over time
Energy Tab View
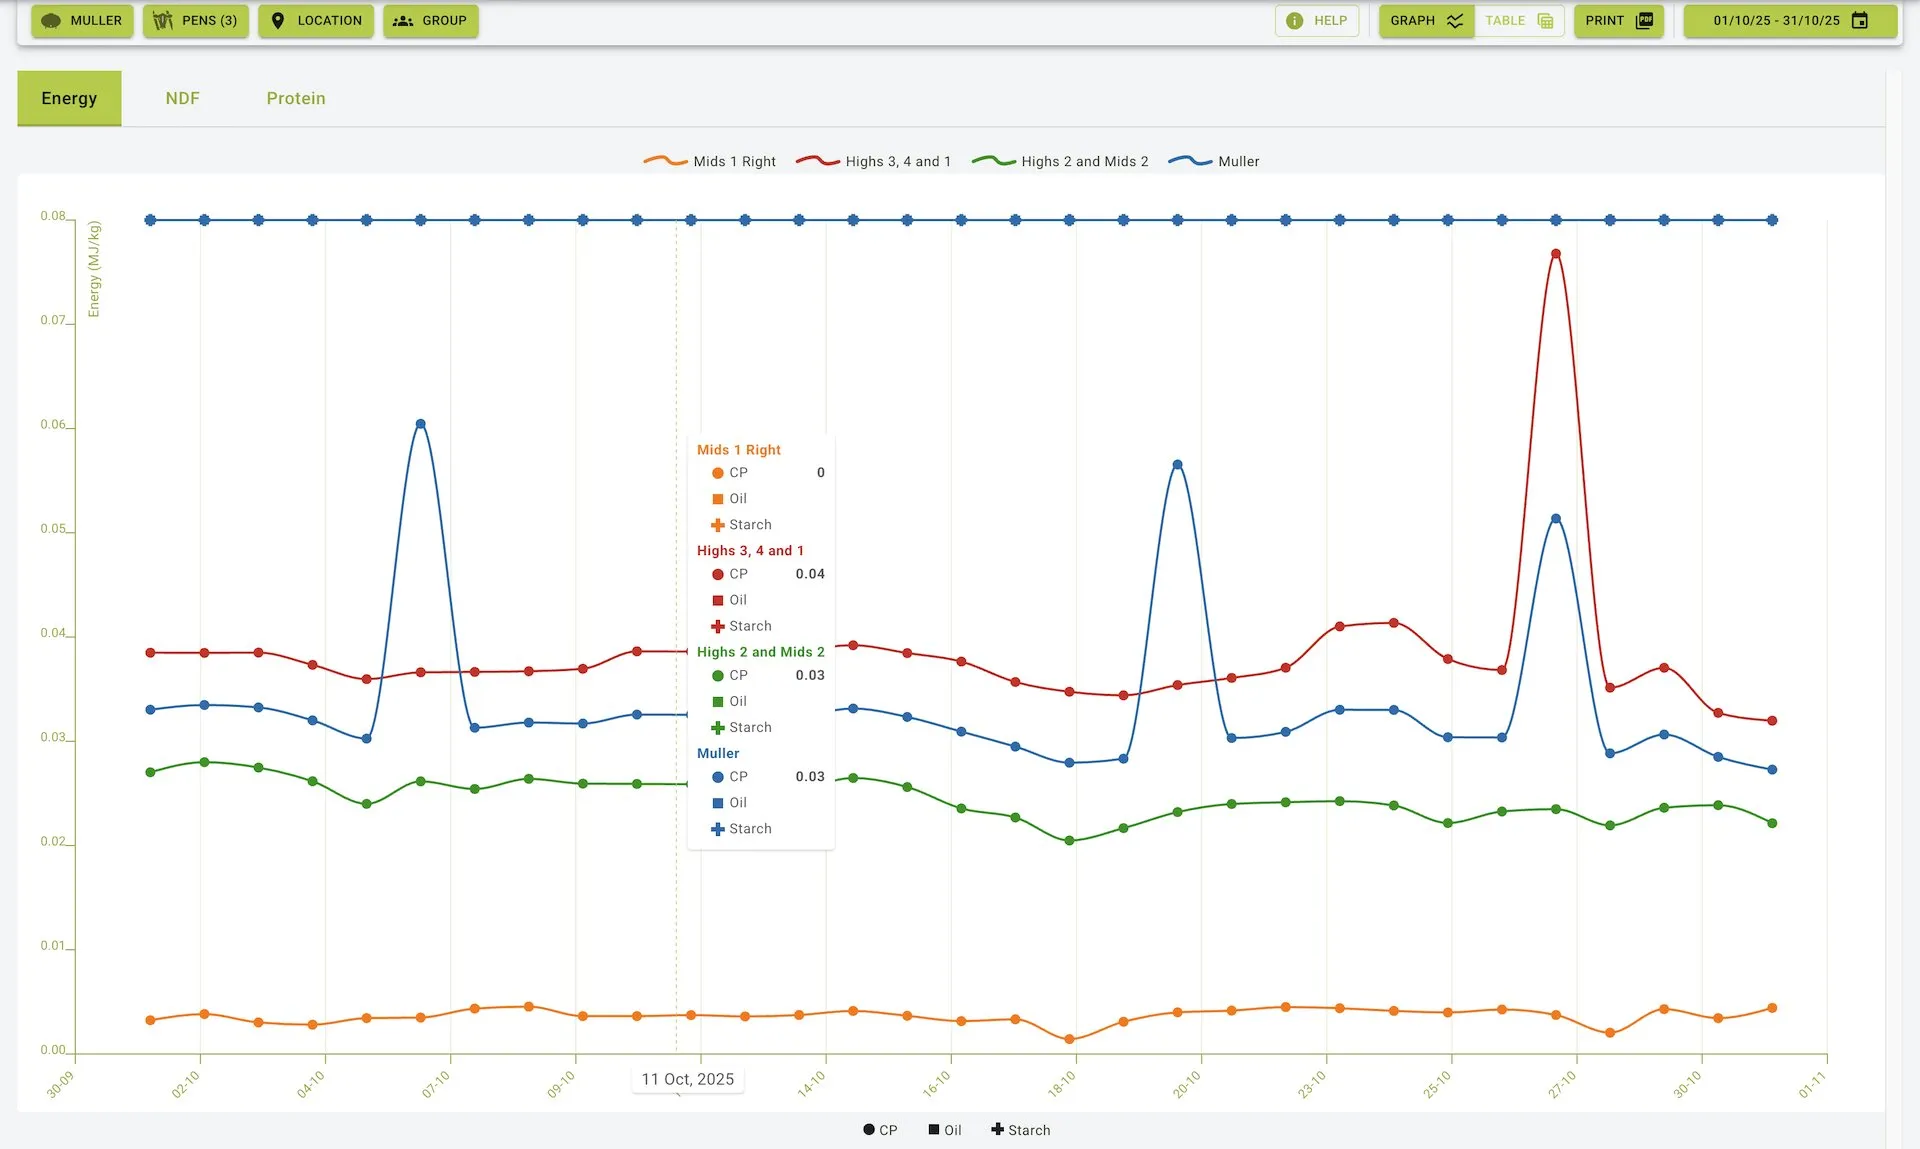
Data Representation
- Interactive Graph: Shows energy component trends over the selected time period
- Color-Coded Lines: Each feed source or location is represented by a different color
- Green: Highs 3, 4 and 1
- Orange: Highs 2 and Mids 2
- Blue: Muller
- Purple: Shed 1
- Component Indicators: Different markers and colors for each nutritional component
- CP (Crude Protein): Circular markers
- Oil: Square markers
- Starch: Diamond markers
- Date Range: Data is plotted against specific dates along the x-axis
- Energy Values: Measurement values are displayed on the y-axis
Analysis Capabilities
- Track changes in energy components over time
- Compare energy profiles across different feed locations
- Identify spikes or drops in specific components
- Assess overall energy quality and consistency
NDF (Neutral Detergent Fiber)
Main Features
- Tracks NDF content across various feed sources
- Displays both Total NDF and Foraged NDF measurements
- Provides comparative visualization between different feed locations
- Shows consistent time-series data for trend analysis
NDF Tab View
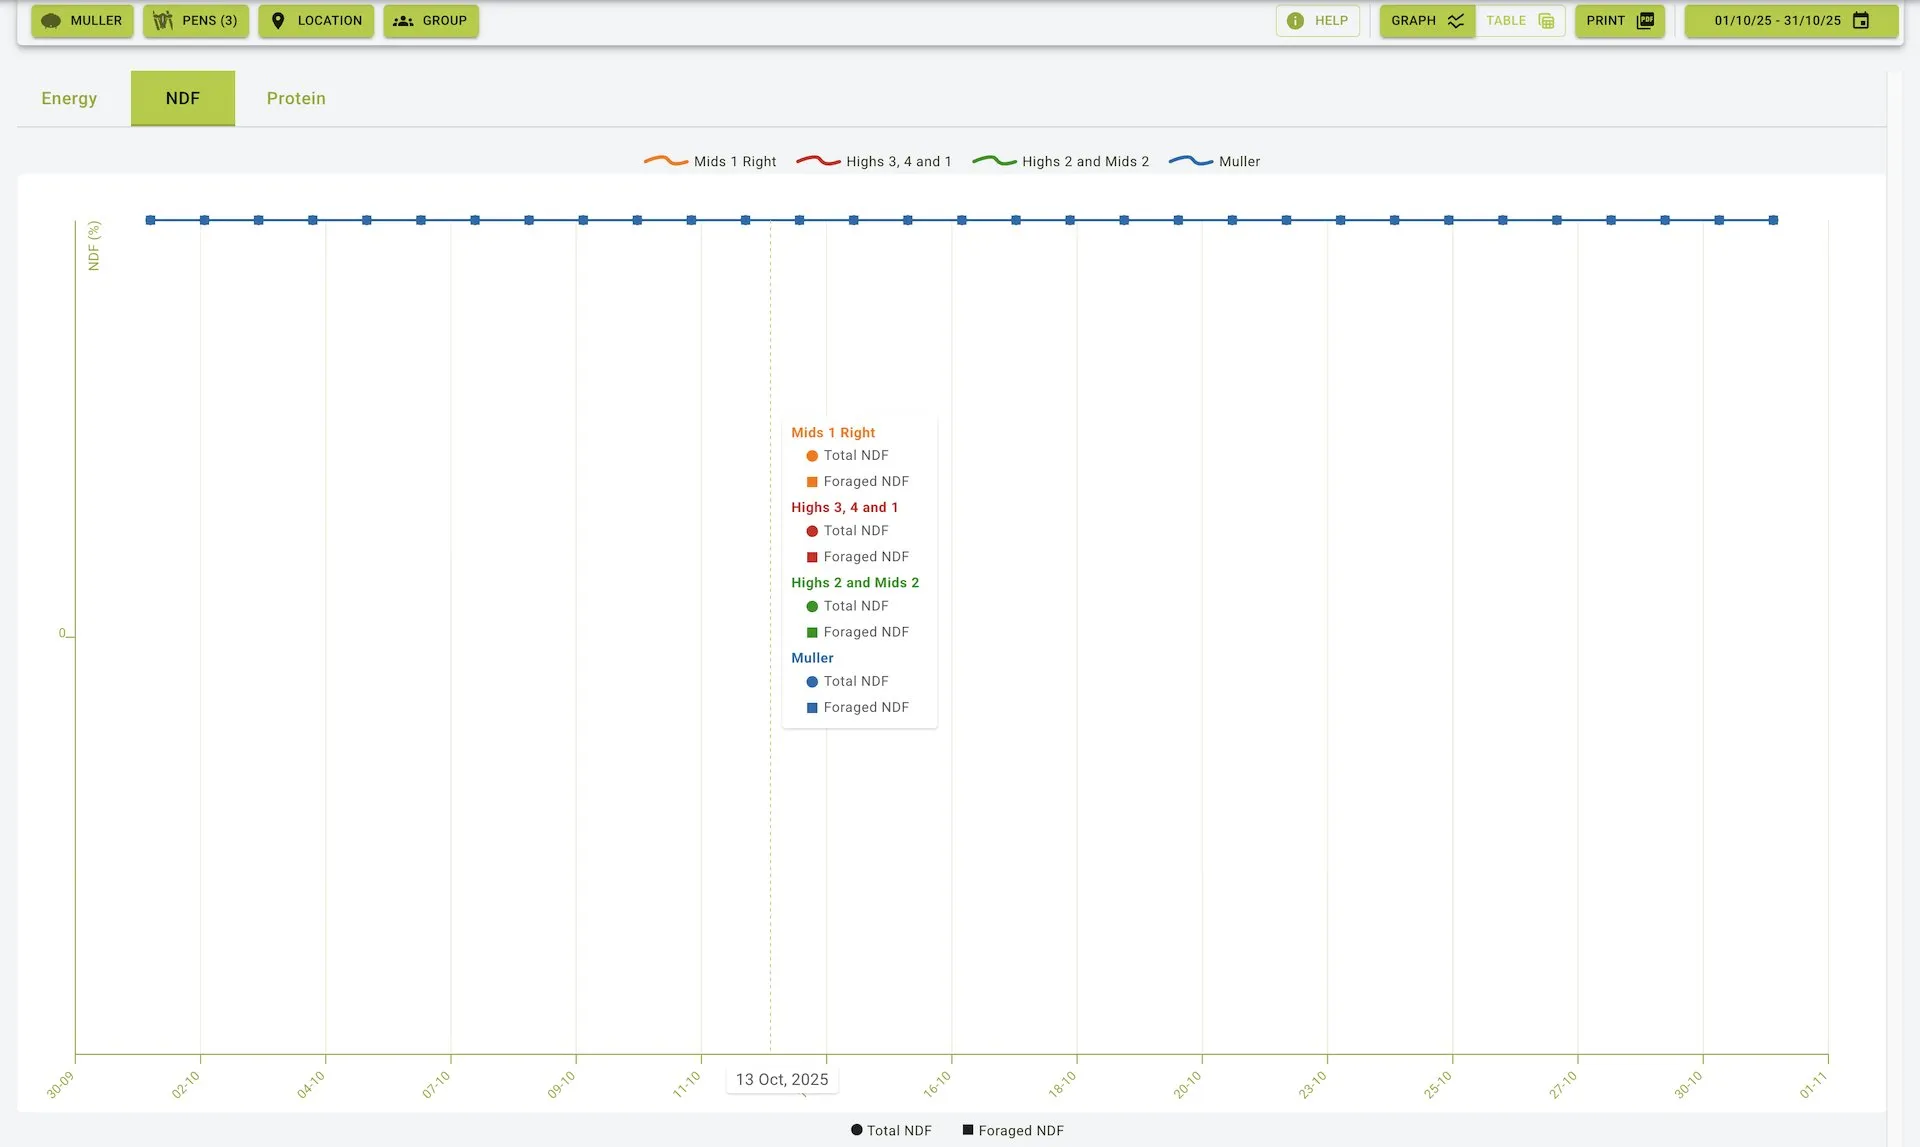
Data Representation
- NDF Measurement Graph: Visualizes NDF content over the selected time period
- Color-Coded Feed Sources:
- Green: Highs 3, 4 and 1
- Orange: Highs 2 and Mids 2
- Blue: Muller
- Purple: Shed 1
- NDF Components:
- Total NDF: Represented by circular markers
- Foraged NDF: Represented by square markers
- Time-Based Analysis: Data points plotted against specific dates
- Measurement Scale: NDF values clearly indicated on the vertical axis
Analysis Capabilities
- Monitor fiber content consistency over time
- Compare NDF profiles between different feed sources
- Evaluate the ratio between total and foraged NDF
- Identify trends that may affect digestibility and feed intake
Protein
Main Features
- Measures protein content across different feed sources
- Displays both CP (Crude Protein) and MP (Metabolizable Protein) values
- Enables comparative analysis between locations
- Provides detailed time-series data for protein content evaluation
Protein Tab View
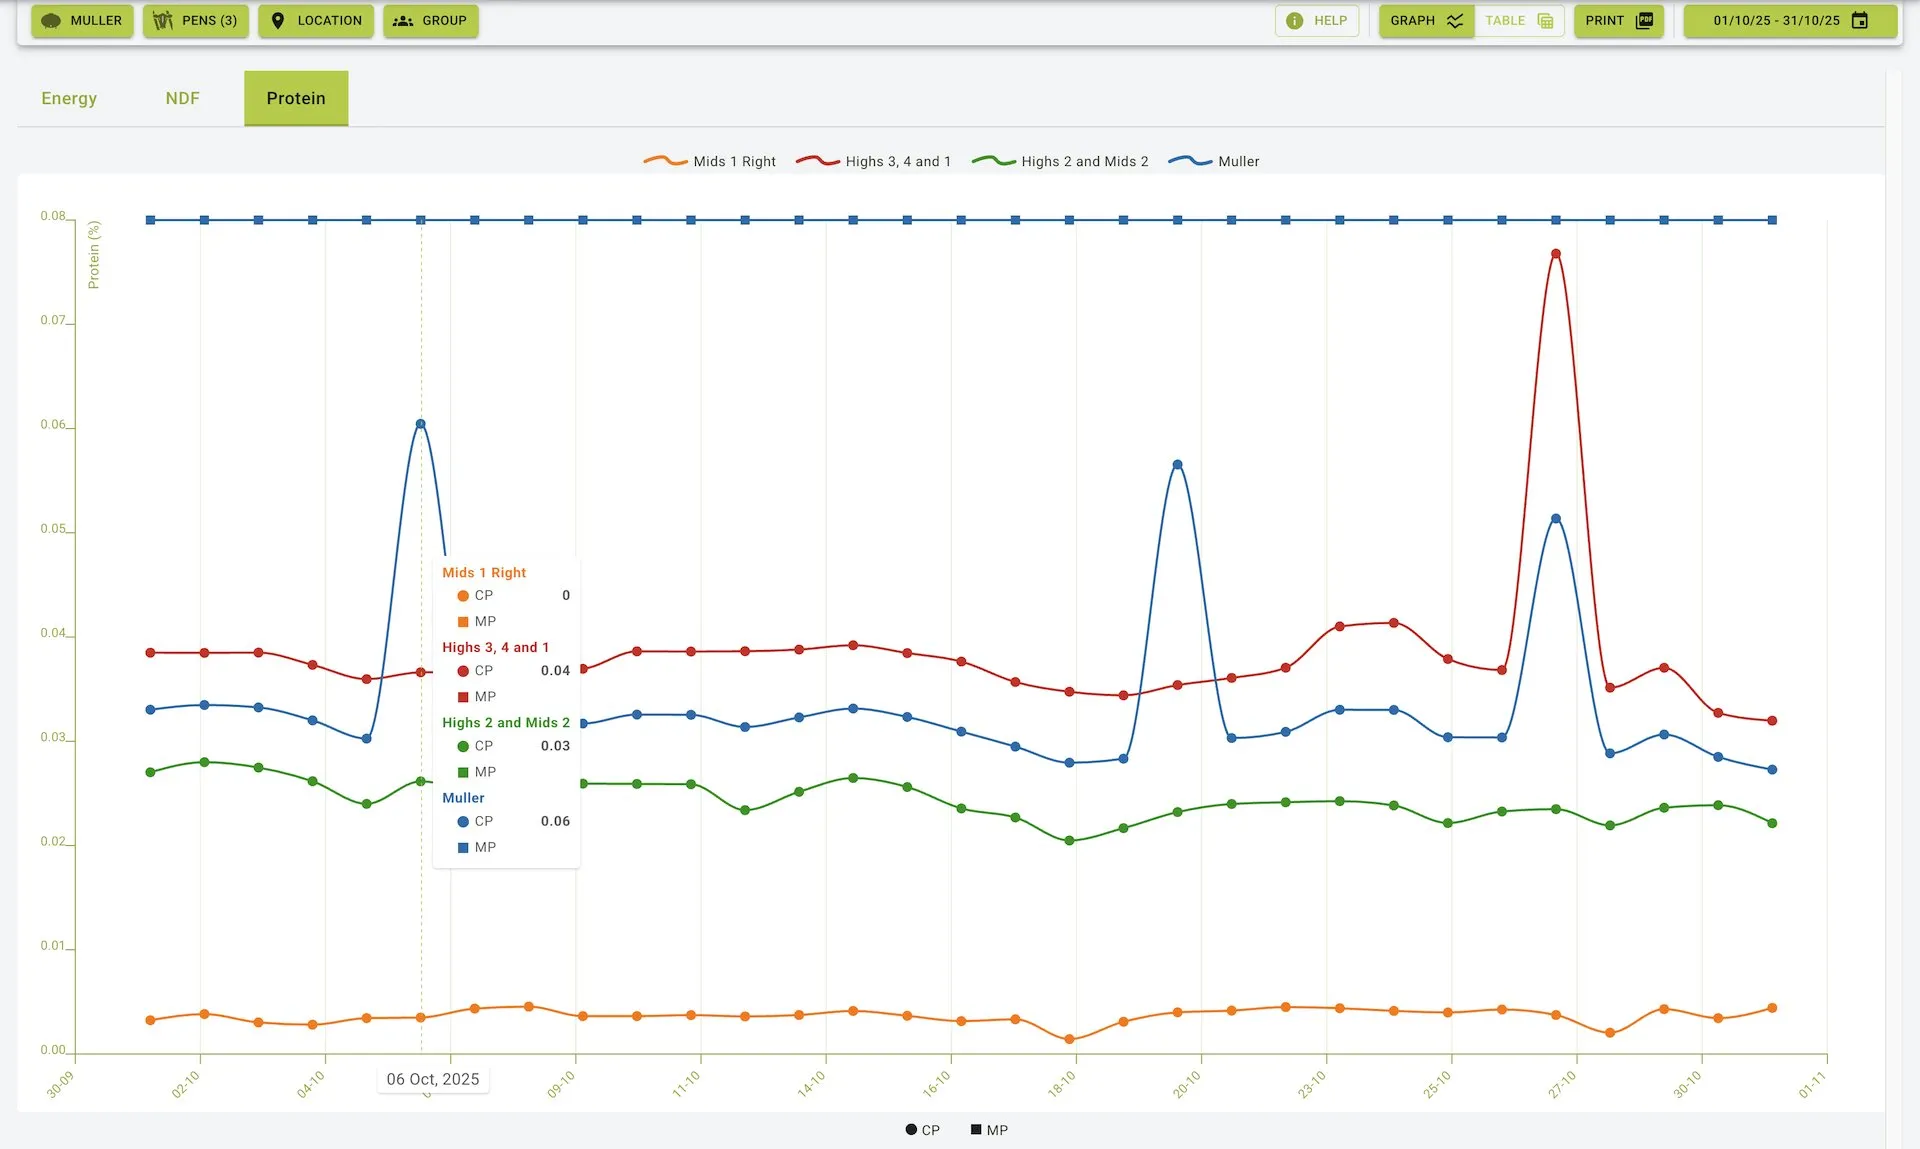
Data Representation
- Protein Content Graph: Shows protein measurements over the selected time period
- Color-Coded Feed Sources:
- Green: Highs 3, 4 and 1
- Orange: Highs 2 and Mids 2
- Blue: Muller
- Purple: Shed 1
- Protein Components:
- CP (Crude Protein): Represented by circular markers
- MP (Metabolizable Protein): Represented by square markers
- Chronological Display: Data plotted against specific dates
- Measurement Values: Protein content shown on the vertical axis with precise scaling
Analysis Capabilities
- Track protein content changes over time
- Compare protein profiles between different feed sources
- Identify variations in CP and MP ratios
- Evaluate overall protein quality and consistency
Practical Use Cases
Feed Quality Monitoring
- Track nutritional consistency over time
- Identify seasonal variations in feed components
- Monitor the effects of feed storage on nutritional quality
Feed Comparison
- Compare nutritional profiles between different feed sources
- Evaluate the effectiveness of different feed suppliers
- Assess the impact of feed location on nutrient preservation
Nutritional Planning
- Use historical nutrient data to inform future feed purchases
- Identify optimal feed sources based on consistent nutrient profiles
- Plan dietary adjustments based on observed nutritional trends
Problem Identification
- Spot sudden changes in nutritional content that may indicate issues
- Identify potential contamination or degradation through nutrient profile changes
- Detect feed mixing or processing inconsistencies
General Features
Selection Controls
- Feed Source Selector: Dropdown menu to choose specific feed sources
- Location Selector: Dropdown to select feed locations for analysis
- Date Range Picker: Calendar interface to select specific time periods (e.g., 01/07/25 - 31/07/25)
Display Options
- Graph/Table Toggle: Switch between graphical and tabular data representations
- Print Button: Generate printable reports of the nutrient data
- Help Button: Access guidance on using the nutrient data features
Summary
The Nutrient Data feature provides a powerful tool for analysing and tracking nutritional components in feeds over time. By offering detailed visualizations of Energy, NDF, and Protein content across different feed sources and locations, it enables users to:
- Monitor feed quality and consistency
- Make informed decisions about feed sourcing and management
- Identify trends and patterns in nutritional content
- Compare nutritional profiles between different feed locations
- Track the effects of storage and handling on feed quality
With its interactive graphs and comprehensive data representation, the Nutrient Data feature helps optimize feed management and animal nutrition strategies.