Loads Timeline
Description
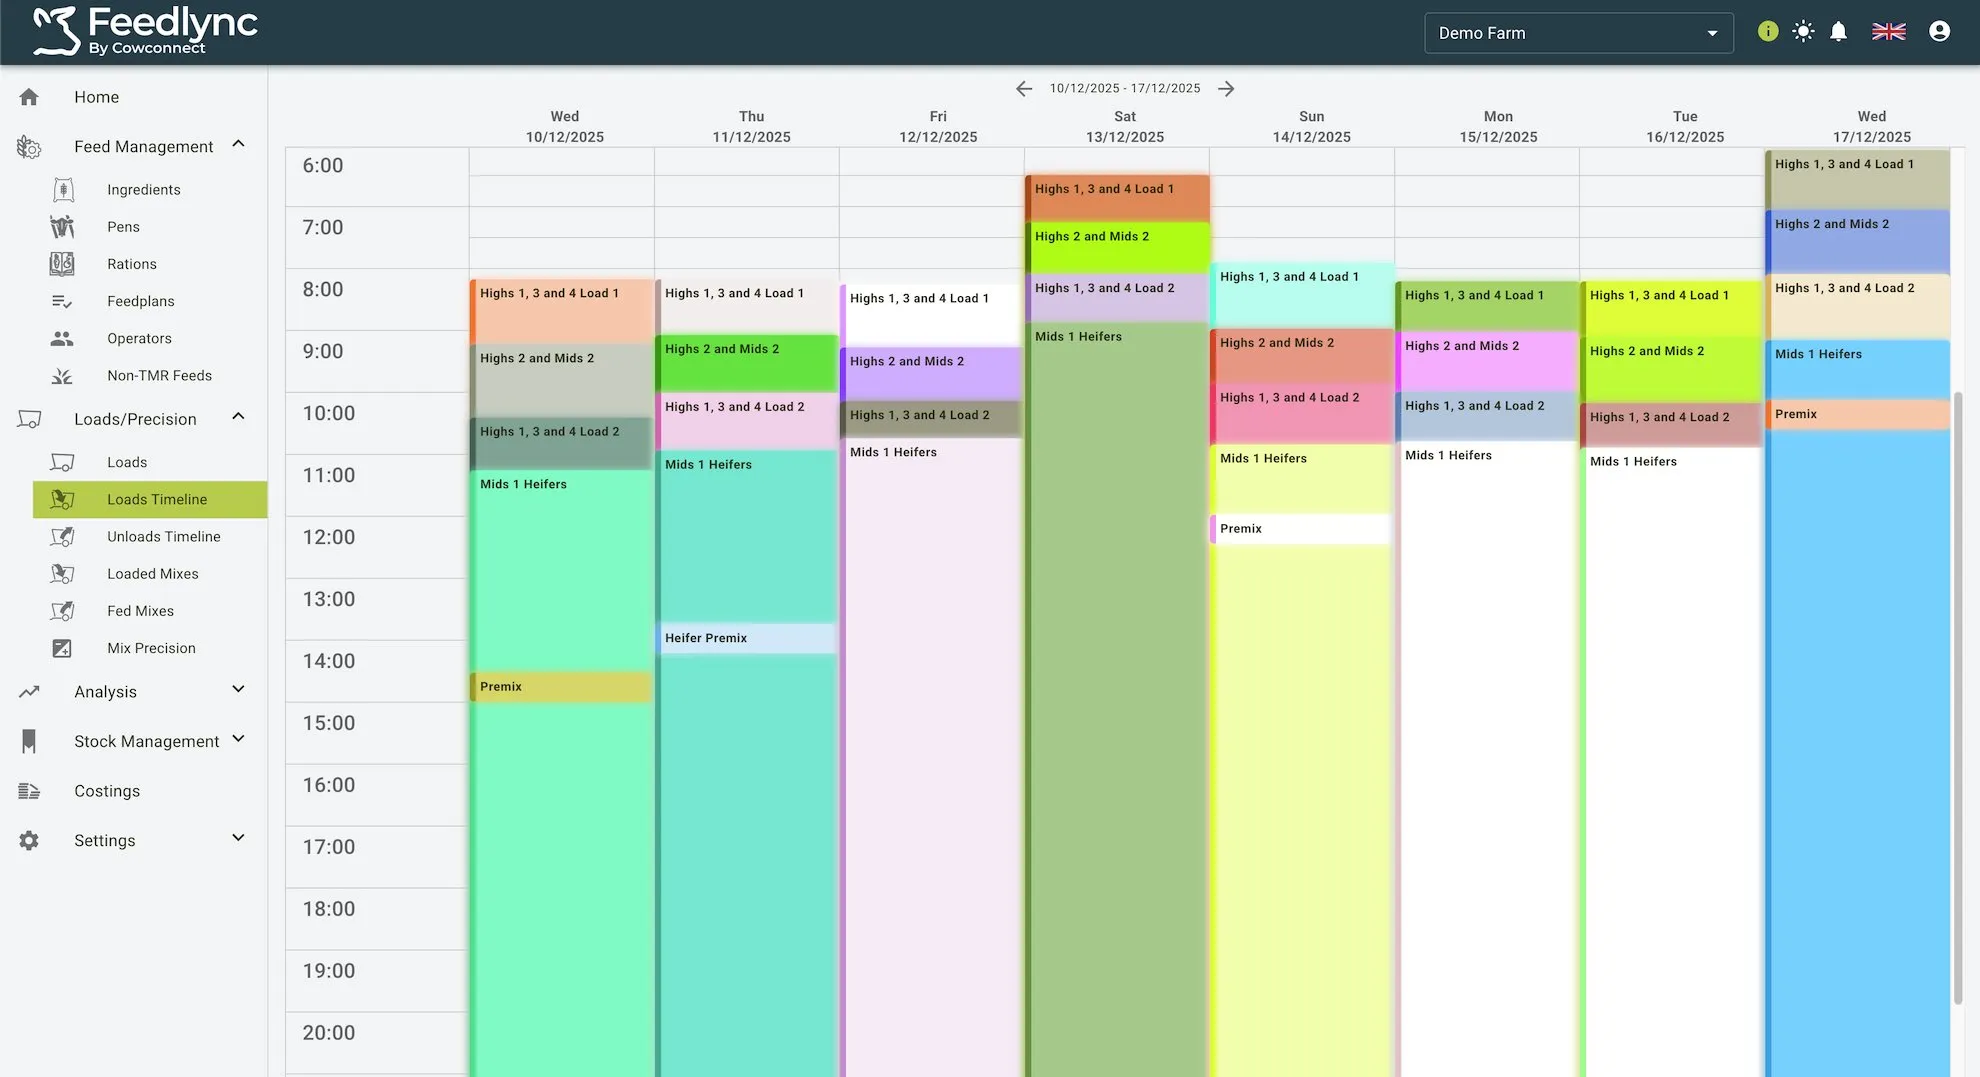
The Loads Timeline gives a calendar-style view of completed loads for the selected week. Each coloured block represents a load, showing when it started and how long it took to finish. Columns are grouped by day so you can quickly see how loading activity was spread across the week.
Timeline layout
- Day columns: Each column is a single day; only loads completed on that day appear in that column.
- Start time and duration: Blocks start at the load start time and extend down the timeline to indicate how long the load took to complete.
- Load labels: Text on each block shows the feed plan or ration name and the load number (for example, “Highs 1, 3 and 4 Load 1”).
- Colour coding: Different colours make overlapping or consecutive loads easy to distinguish at a glance.
Navigation
- Week selector: The date range above the timeline shows the current week.
- Previous/next arrows: Use the arrows on either side of the date range to move backward or forward one week at a time and review other completed loads.
- Scroll: Scroll vertically to see early-morning or late-evening loads if they are outside the current viewport.
Reading a load block
- Placement: The top of the block is the load start time; the bottom marks completion, so taller blocks represent longer loads.
- Overlap: When loads overlap in time, blocks appear side-by-side in the same day column, helping you spot potential resource conflicts.
- Context: Use the load label to match what you see in the timeline to the detailed data in the Loads table if you need ingredient or cost details.
Practical uses
- Verify that loads were completed during the expected time windows.
- Spot days with heavy activity or overlapping loads that may need staffing adjustments.
- Step through weeks to confirm recurring schedules (e.g., premix days) are being followed.
Loads Timeline View