Physical Data
Description
The Physical Data section of the software provides seven detailed tabs, enabling users to monitor key metrics like milk yield, cow numbers, dry matter intake, and more. The data can be viewed in both tabular and graphical formats, with options for exporting reports as printed graphs or tables. A date filter allows users to specify time periods for analysis.
1. Milk Yield Tab
Description:
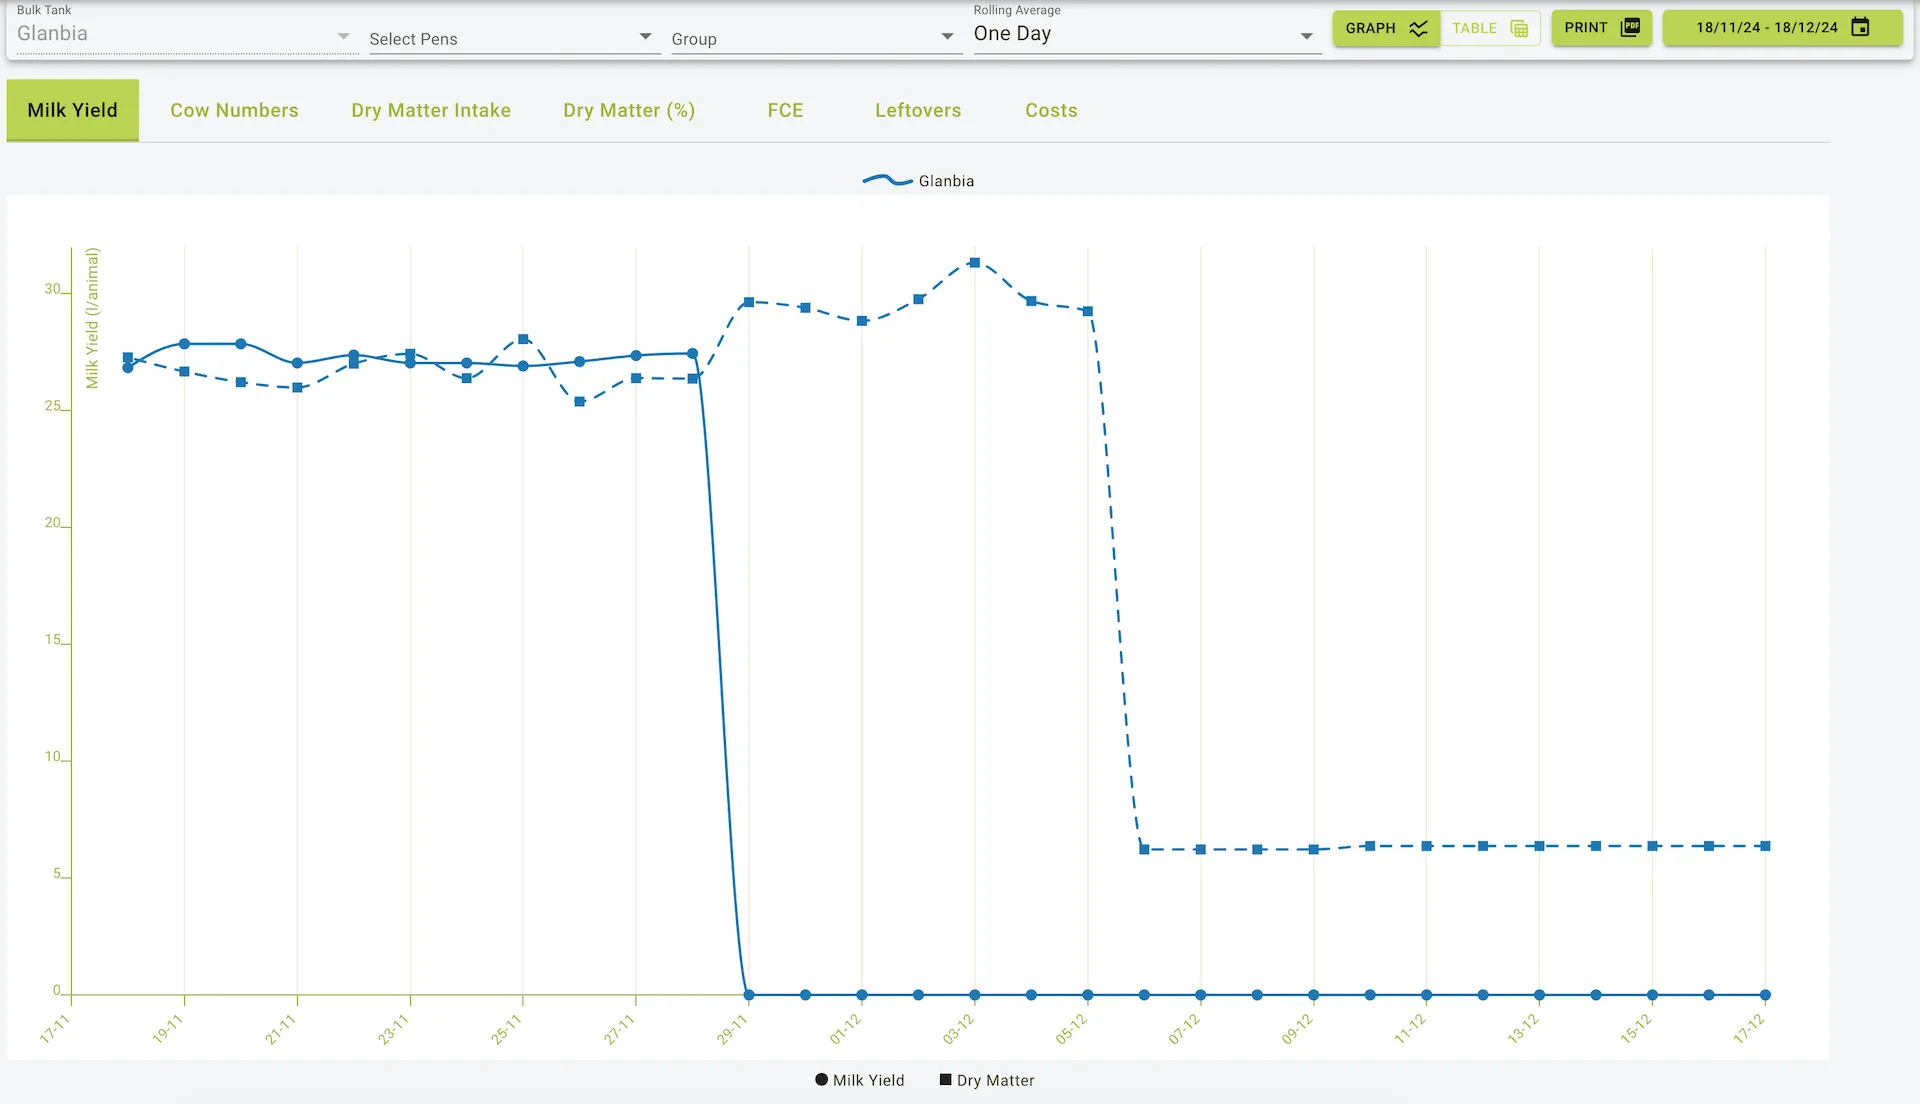
This tab displays the average milk yield per animal for each date in the selected date range.
Fields:
- Date: The specific date of the record.
- Yield / Animal: The average milk yield per animal (in liters or kilograms).
- Dm/Animal: The average DM per Animal
Use Case:
Users can refer to this tab to:
- Monitor daily milk production trends.
- Compare milk yields across different dates to identify potential issues or improvements in production.
- Assess the impact of feed or environmental changes on milk production.
2. Cow Numbers Tab
Description:
This tab provides the total number of cows present on each date within the selected range.
Fields:
- Date: The specific date of the record.
- Number of Animals: The total number of cows recorded for that day.
Use Case:
- Track changes in herd size over time.
- Use alongside other metrics like milk yield and feed intake for performance evaluation.
- Verify accuracy of recorded herd data.
3. Dry Matter Intake Tab
Description:
This tab shows the daily dry matter intake (DMI) per animal for each date in the selected range.
Fields:
- Date: The specific date of the record.
- Dry Matter Intake (DM/Animal): The average dry matter intake per animal.
- Dry Matter Leftover (DM/Animal): The average dry matter Leftover per animal.
Use Case:
- Evaluate whether the cattle are consuming sufficient dry matter for optimal productivity and health.
- Correlate DMI with milk yield or other performance metrics.
4. Dry Matter (%) Tab
Description:
This tab calculates and displays the percentage of dry matter in the feed for each date.
Fields:
- Date: The specific date of the record.
- Dry Matter (%): The percentage of dry matter in the feed.
Use Case:
- Ensure feed quality consistency.
- Compare feed compositions and their effects on productivity.
- Adjust feeding strategies based on dry matter percentages.
5. FCE (Feed Conversion Efficiency) Tab
Description:
This tab measures feed conversion efficiency, showing how effectively feed is being converted into milk production or weight gain.
Fields:
- Date: The specific date of the record.
- FCE: Feed Conversion Efficiency value.
Use Case:
- Monitor the efficiency of feeding programs.
- Identify opportunities to improve feed utilization.
- Correlate with cost and yield metrics for strategic adjustments.
6. Leftovers Tab
Description:
This tab provides data on leftover feed for each date, expressed in kilograms per animal.
Fields:
- Date: The specific date of the record.
- Leftover (Kg/Animal): The average leftover feed per animal.
Use Case:
- Minimize feed wastage.
- Evaluate feeding practices to ensure optimal quantities are being provided.
- Identify over- or under-feeding issues.
7. Costs Tab
Description:
This tab shows feed costs, including total and purchased feed costs, for each date.
Fields:
- Date: The specific date of the record.
- Feed Cost: Total feed cost for the day.
- Purchased Feed Cost: Cost of purchased feed for the day.
Use Case:
- Track and manage feed expenses.
- Compare costs with milk yield or DMI to calculate profitability.
- Assess the economic efficiency of feeding strategies.
General Features of the Reports
- Graphical View:
- Data from all seven tabs can be visualized in graph format for easier trend analysis.
- Graphs can be printed as PDF directly from the interface.
- Table View:
- Detailed data is presented in tabular format .
- Date Filters:
- Allows users to specify time ranges for data analysis.
- Available for all tabs.
When to Use These Reports
- Milk Yield: To track and improve milk production efficiency.
- Cow Numbers: To maintain accurate herd records and correlate with performance metrics.
- Dry Matter Intake: To ensure optimal feed consumption for health and productivity.
- Dry Matter (%): To monitor feed composition and quality.
- FCE: To optimise feed utilization and cost-effectiveness.
- Leftovers: To minimize waste and refine feeding practices.
- Costs: To manage feed expenses and assess profitability.
How to Export Reports
- Graph Export: Use the “Print” button to print the graphical representations.
Filter Options
- Bulk Tank: Select a specific bulk tank
- Pens and Groups: Filter data by specific pens or groups of pens to analyse their performance separately.
- Rolling Average:
- Options include 1-day, 3-day, and 7-day averages.
- What is a Rolling Average?
- A rolling average smooths out short-term fluctuations in the data, providing a clearer view of trends over time.
- For example, a 3-day rolling average calculates the average value over the last three days for each date, helping to identify consistent patterns without the noise of daily variations.
Example view of the physical data page