Mix Precision
Description
The Mix Precision page helps monitor and improve the accuracy of feed loading and ingredient mixing. It includes three tabs:
- Loading Accuracy Heatmap
- Loading Accuracy
- Deviation Value
Users can analyse data across operators, rations, feed plans, and time periods to identify inconsistencies and optimise processes.
Tabs and Features
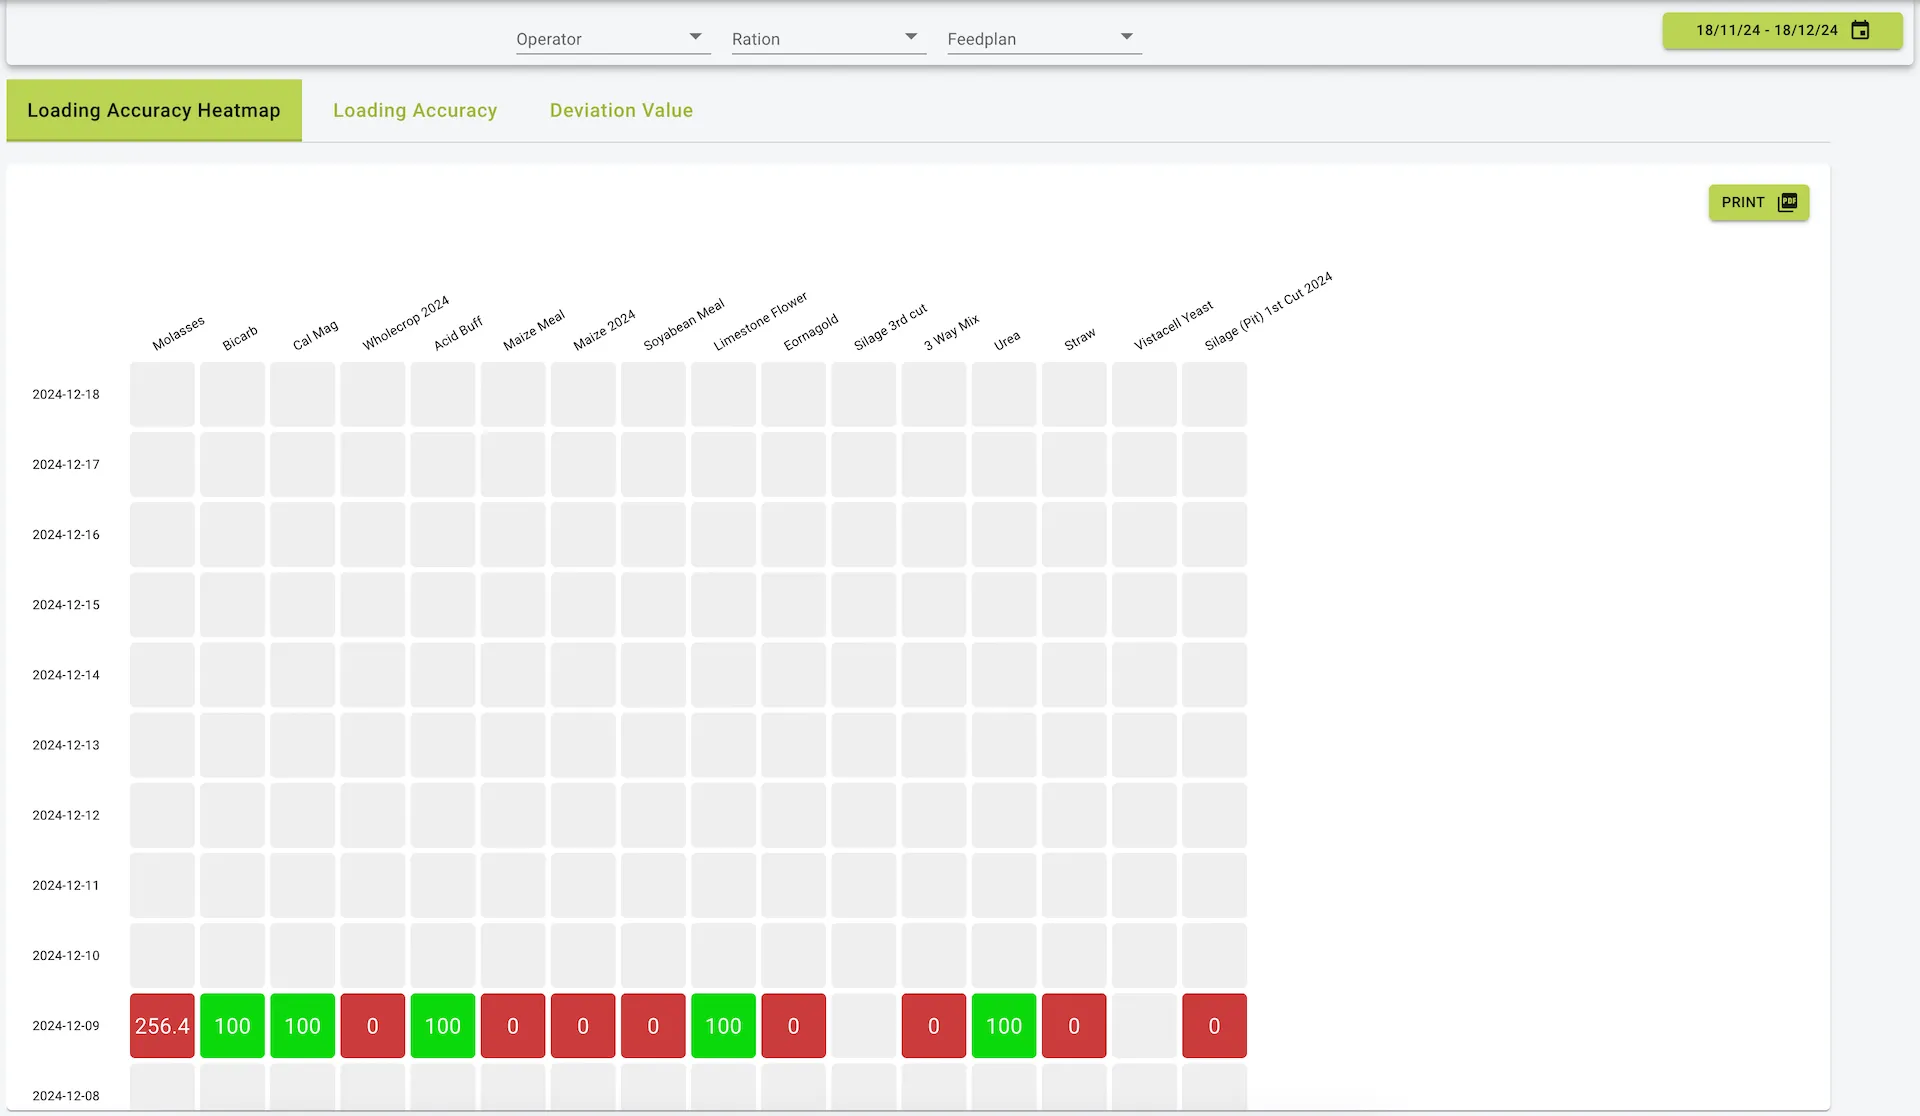
1. Loading Accuracy Heatmap
This tab visually represents loading accuracy for different ingredients across days in a heatmap format.
- Columns: Represent different ingredients.
- Rows: Represent individual days.
- Color Coding:
- Green: Indicates high accuracy.
- Yellow: Indicates moderate deviations.
- Red: Indicates significant deviations from the planned values.
Additional Functionality:
- Filters: Narrow data by operator, ration, or feed plan.
- Date Selector: Adjust the range of displayed data.
- Print Option: Generate a printable version of the heatmap.
2. Loading Accuracy
This tab provides a bar chart representation of loading accuracy for each ingredient.
- Horizontal Axis: Indicates error percentages (positive or negative).
- Bars:
- Green: Accurate or slightly underloaded ingredients.
- Red: Overloaded ingredients.
- Filters: Similar to the heatmap, users can filter by operator, ration, and feed plan.
- Sorting: Allows sorting by error percentages.
- Print Option: Export the chart as a report.
3. Deviation Value
This tab highlights the cost impact of deviations in loading accuracy.
- Metrics Displayed:
- Error percentage for each ingredient.
- Associated cost of the deviation in euros.
- Bar Chart:
- Green: Indicates cost savings or minimal deviations.
- Yellow/Red: Indicates increased costs due to overloading.
- Hover Feature: Hover over a bar to see detailed cost and error data.
- Sorting and Printing: Users can sort ingredients by deviation value and export the data for reporting.
Menu and Navigation Features
- Filters:
- Operator: View data specific to individual operators.
- Ration: Filter data based on rations.
- Feed Plan: Select specific feed plans to analyse.
- Date Range Selector: Limit analysis to specific time periods.
- Export Options: All tabs support exporting data as reports (PDF or Excel).
Practical Use Cases
- Identifying Issues:
- Spot trends of consistent overloading or underloading.
- Highlight costly deviations to improve profitability.
- Improving Operator Performance:
- Monitor individual operator accuracy to identify training needs.
- Enhancing Ingredient Management:
- Evaluate which ingredients contribute to the highest deviations and adjust processes accordingly.
Summary
The Mix Precision page provides detailed insights into the accuracy of feed loading and mixing. With visualizations, cost tracking, and filtering options, it empowers users to maintain precise feed operations, reduce waste, and manage costs effectively.
Example view of the mix precision page